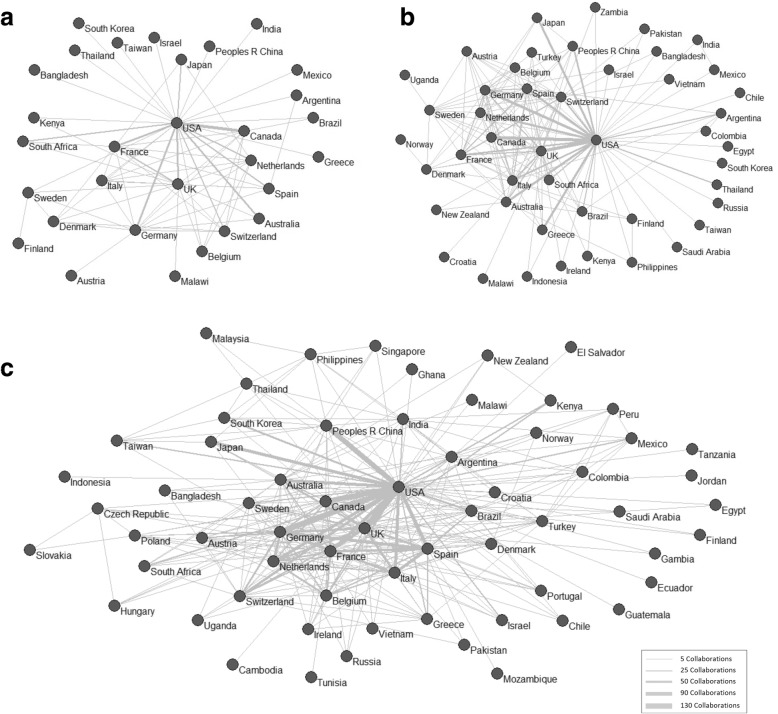
Fig. 1.
Networks generated from international collaborations, by quinquennium: (a) 2001–2005, (b) 2006–2010, and (c) 2011–2015
The intensity of collaboration is reflected through the thickness of the links. The most prominent nodes (those with a greater number of documents and collaboration links) are in the center of the map, while the nodes with a smaller number of publications and lower degree of collaboration are located on the periphery

