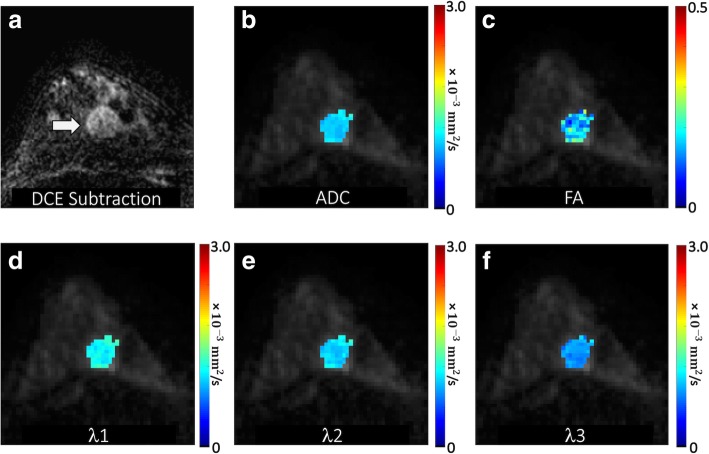
Fig. 1.
Malignant mass detected in a 47-year-old patient undergoing MRI to evaluate newly diagnosed cancer. a DCE post-contrast subtraction image demonstrates an additional 20-mm round mass with irregular margins in the posterior right breast 6 o’clock (arrow), assigned a BI-RADS category 4. DTI-derived parametric maps of b apparent diffusion coefficient (ADC), c fractional anisotropy, and eigenvalues d λ1, e λ2, and f λ3 are shown for the lesion regions overlaid in color on the b = 800 s/mm2 image. ADC, λ1, λ2, and λ3 are in units of 10−3 (mm2/s). The mass demonstrated low ADC (mean ADC = 1.09 × 10⁻³ mm2/s) with FA = 0.18, λ1 = 1.27 × 10⁻³ mm2/s, λ2 = 1.11 × 10⁻³ mm2/s, and λ3 = 0.87 × 10⁻³ mm2/s. Biopsy revealed a malignant grade 1 invasive ductal carcinoma

