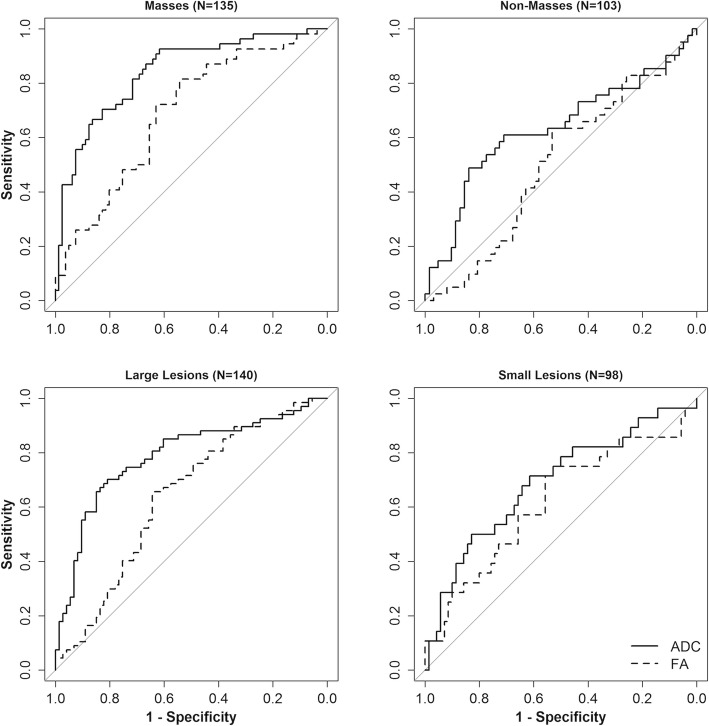
Fig. 6.
ROC curves for individual DTI parameters within the lesion subgroups defined by type or size. AUC estimates were significantly higher in masses than non-masses for both ADC (AUC 0.84 [95% CI 0.77–0.91] vs. 0.63 [95% CI 0.52–0.75], p = 0.002) and FA (AUC 0.69 [95% CI 0.59–0.79] vs. 0.50 [95% CI 0.40–0.61], p = 0.013). By contrast, AUC estimates were not significantly different between large (≥ 1 cm) and small (< 1 cm) lesions for both ADC (AUC 0.79 [95% CI 0.71–0.86] vs. 0.69 [95% CI 0.57–0.81], p = 0.18) and FA (AUC 0.64 [95% CI 0.55–0.73] vs. 0.62 [95% CI 0.49–0.75] p = 0.80)

