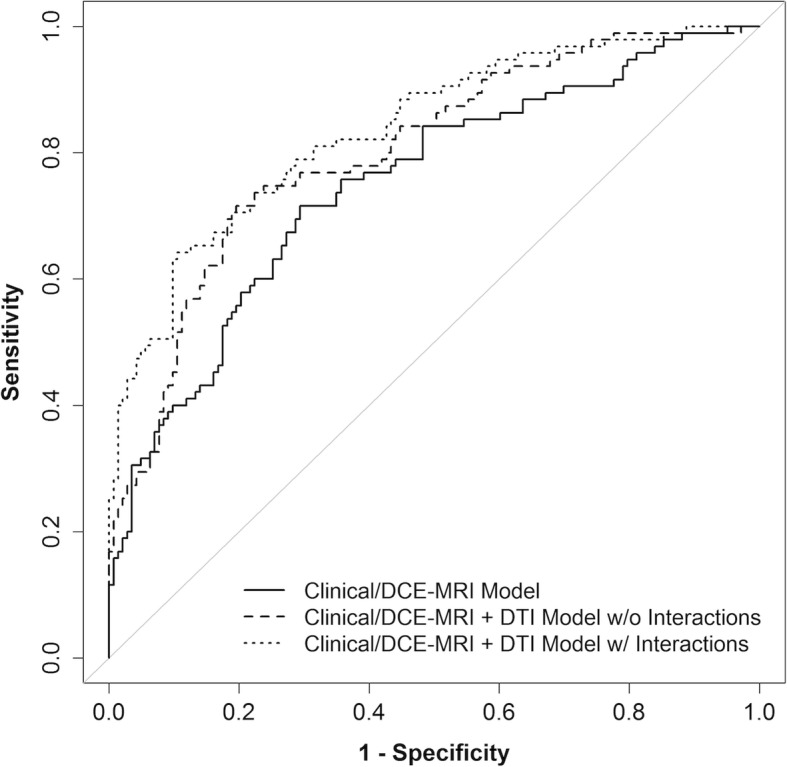
Fig. 7.

Comparison between the cross-validated ROC curve for Clinical/DCE-MRI+DTI+interactions model and curves for Clinical/DCE-MRI-only and Clinical/DCE-MRI+DTI models. The interaction terms were size × ADC, type × ADC, size × FA, and type × FA and allowed the model to have different odds ratios for ADC and FA for each size × type subgroup. The bootstrap-adjusted AUC estimates were 0.76 (95% CI 0.71–0.83), 0.81 (95% CI 0.78–0.88), and 0.85 (95% CI 0.82–0.90), respectively. The Clinical/DCE-MRI+DTI+interactions model had a significantly higher AUC than the Clinical/DCE-MRI+DTI model (p = 0.018)
