Figure 4.

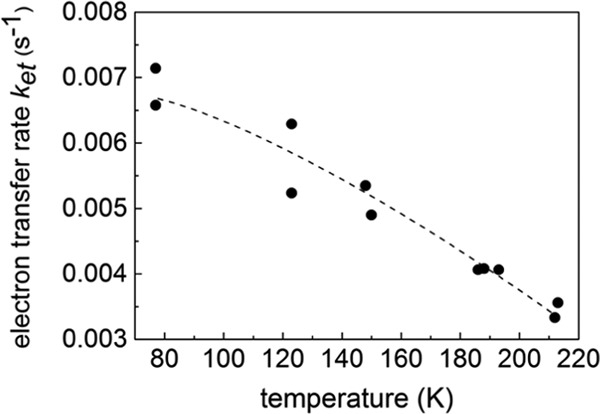
Variation of the recombination reaction rate of the S2tYZ•/QA•– pair with temperature of induction of the S2t state. The recombination reaction kinetics were followed at 10 K. The dashed line is drawn only as an aid to the eye.

Variation of the recombination reaction rate of the S2tYZ•/QA•– pair with temperature of induction of the S2t state. The recombination reaction kinetics were followed at 10 K. The dashed line is drawn only as an aid to the eye.