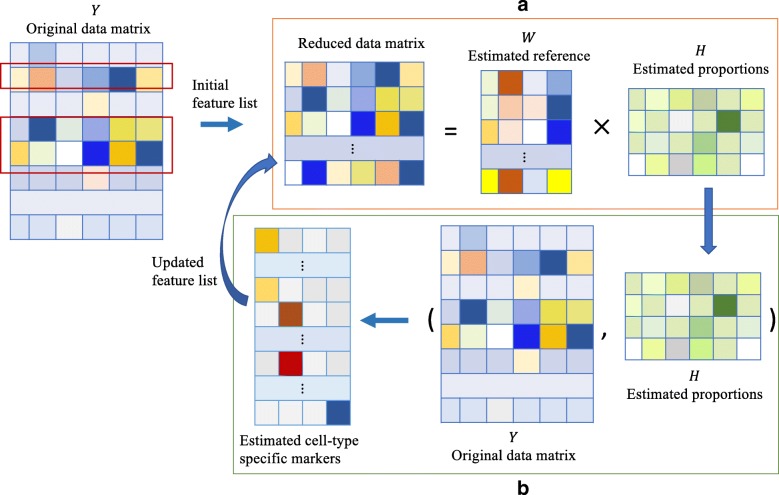
Fig. 1.
A schematic plot to illustrate the proposed method. We assume four cell types (K = 4) and six subjects (N = 6). Our method starts with the original data matrix Y and a list of initial markers. In step a, mixture proportions are estimated using existing RF deconvolution algorithms. In step b, cross-cell type differential analysis is performed to identify cell type specific-features as updated feature list. We improve the feature selection and RF deconvolution through iterating steps (a) and (b)

