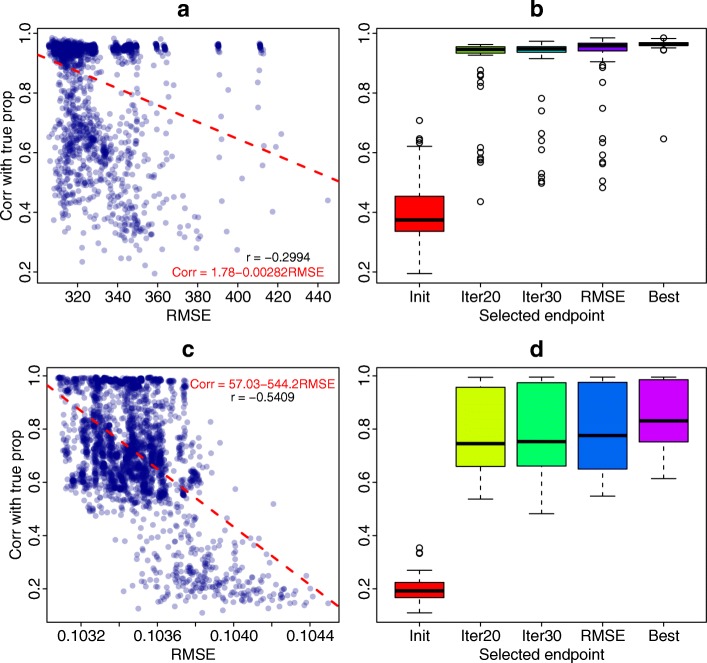
Fig. 4.
Exploration of endpoint selection. a, b Results from gene expression simulation settings. c, d DNA methylation simulation settings. a, c Negative correlations between RMSE and the correlations of estimated versus true proportions. b, d The boxplots of correlations with true proportion using different endpoint selection methods. Init is based on the initial features. Iter20 is based on features after 20 iterations. Iter30 is based on features after 30 iterations. RMSE is based on results with the smallest RMSE in 30 iterations. Best is the best possible correlations over all iterations (not obtainable in real data analysis)

