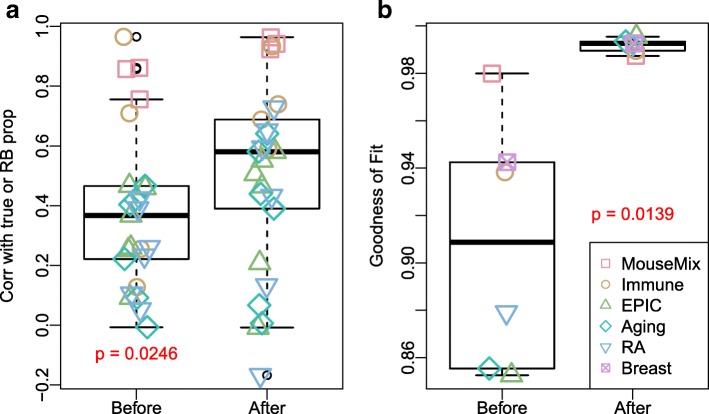
Fig. 6.
The proposed method improves the deconvolution results in real data applications. Boxplots show the evaluation metrics before and after updating features. a The correlation of estimated versus true (Mouse-Mix, Immune datasets) or reference-based deconvolution solved proportions (EPIC, Aging, RA datasets). b The goodness of fit for the deconvolution models before and after applying TOAST. The “Before” columns in both plots are baseline reference-free results without applying TOAST. Small jitter noises are added to points to provide better visualization

