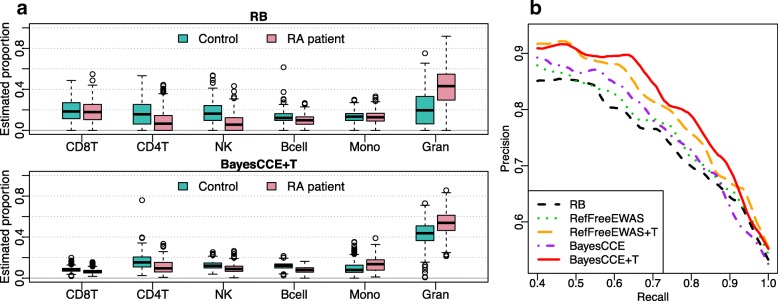
Fig. 8.
Results from the analysis of RA dataset (GSE42861). a The boxplots of estimated proportions of RA patients and controls from reference-based (RB) deconvolution method and BayesCCE with TOAST (BayesCCE+T). b The precision-recall curve for predicting disease status using estimated proportions from different methods. RefFreeEWAS and BayesCCE are baseline performance without applying TOAST. Results averaged from tenfold cross validation are used to generate the curves

