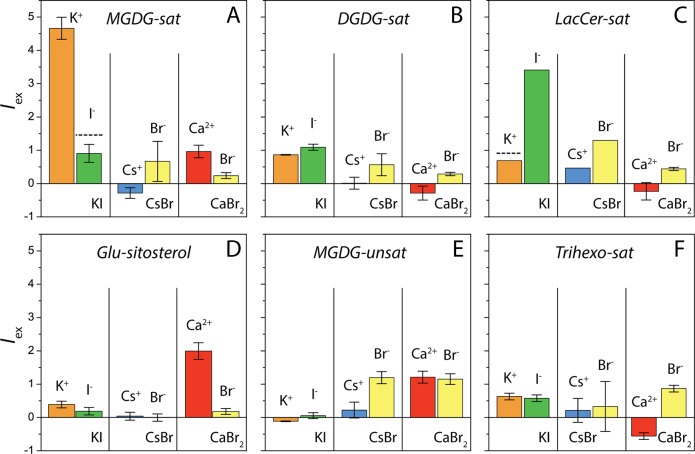
Figure 4.
Relative excess fluorescence intensities of K+, I–, Cs+, Br–, and Ca2+ near various uncharged glycolipid monolayers on aqueous subphases containing 1 mM KI, CsBr, or CaBr2. Data are averages over up to three measurements at Π = 10, 20, and 30 mN/m. Error bars represent one standard deviation. They are absent when only one data point was available. Horizontal dashed lines in panels (A) and (C) indicate the intensity level expected from a generic charge-neutralization effect (see the main text).

