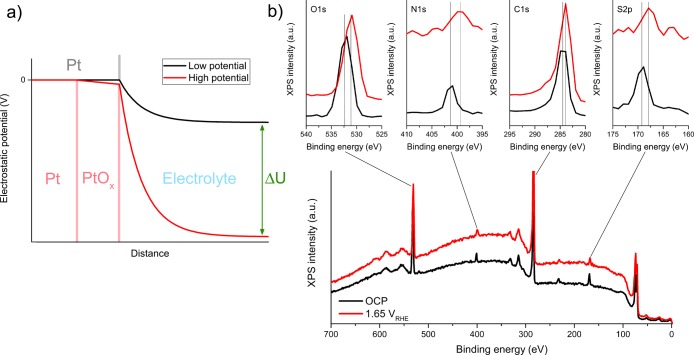
Figure 3.
Influence of the local electrostatic potential on XPS peak positions. (a) Schematic representation of the electrostatic potential around the Pt particles. ΔU designates the difference in applied potential between the two depicted situations. The potential drop in the electrolyte can adopt a variety of functional forms but is shown as simple Gouy–Chapman exponential decay here. (b) Survey spectra of 16 nm graphene-covered Pt on FAD55 at open circuit potential (0.05 V) and 1.65 V, with an excitation energy of 1100 eV and 0.1 M H2SO4 electrolyte.

