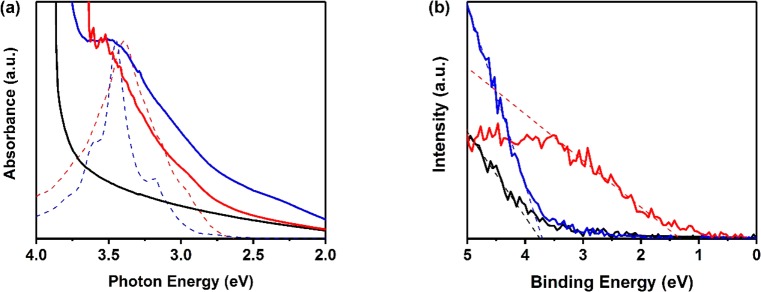
Figure 4.
(a) UV–vis absorbance spectrum of GQDC42 (blue) and GQDC42-PhCOOH (red) sensitized SnO2 films and for sensitizers dispersed in solution (dashed lines). The spectrum of bare SnO2 film is also shown (solid black line). (b) Valence band X-ray spectra of GQDC42 (blue) and GQDC42-PhCOOH (red) sensitized and bare (black) SnO2 electrodes. The dashed lines are linear fits enabling binding energy estimates for the analyzed systems.

