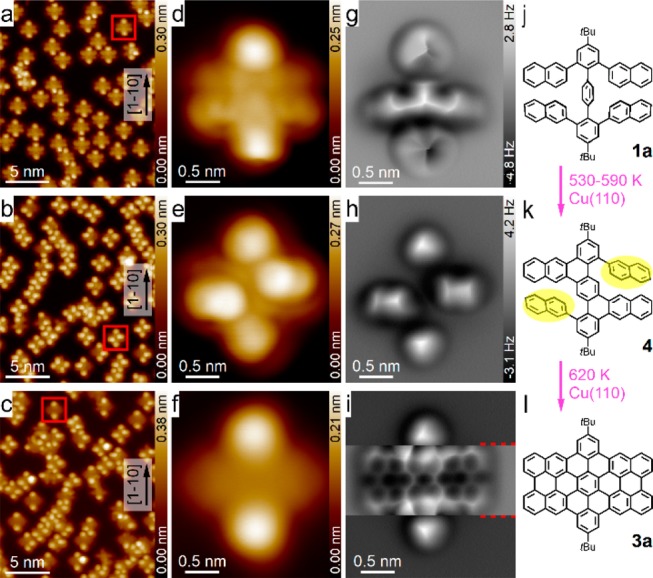
Figure 2.

Cyclodehydrogenation reactions of TNTP-tBu 1a on Cu(110). (a–c) STM overview images that were obtained after the evaporation of 1a (a), and after annealing the sample at 590 K (b) and at 620 K (c). (d–f) STM zoomed-in images of an initial TNTP-tBu molecule, a typical intermediate molecule and a final product molecule, respectively. (g–i) Constant-height frequency shift AFM images of the three molecules shown in (d–f); (j–k) corresponding chemical structures. Imaging parameters: (a–e) 0.1 V, 10 pA; (f) 10 mV, 100 pA; and tip heights Z = +50 pm (g), +130 pm (h), and +120 pm (i) (Z = −120 pm for the region between the two red dashed lines in (i)), where the ± signs represent the increase/decrease of the tip–sample distance relative to the STM set point (0.1 V, 10 pA) on the adjacent Cu(110) surfaces. Since the contrast in (i) is separately optimized for the middle section and the top/bottom sections, an overall color bar is not given.
