Figure 2.
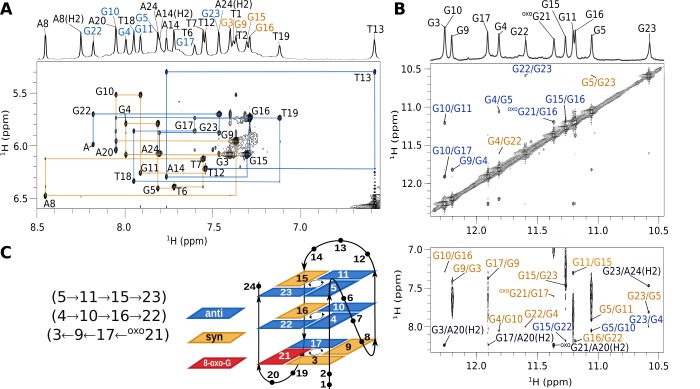
hTel-oxoG21 assignment of NOESY spectra and G-quadruplex topology. (A) Aromatic–anomeric region of a NOESY spectrum (τm = 250 ms). Assignments are shown next to H6/H8n-H1n′ cross-peaks. Orange lines connect cross-peaks from G3 to T12 and blue lines from T12 to A24. Letter “A” indicates the G22H8-oxoG21H1′ cross-peak. 1D trace of the NOESY spectrum is shown on the top with signal assignments, where assignments corresponding to syn and anti guanine nucleotides are shown in orange and blue, respectively. Adenine and thymine resonances are in black. (B) Imino–imino (top) and imino–aromatic (bottom) regions of the NOESY spectrum. Assignments in blue and orange represent cross-peaks between guanines of the inner and outer G-quartets, respectively. Assignments in black correspond to cross-peaks between H1 protons of guanines and aromatic protons of adenines. (C) hTel-oxoG21 G-quadruplex topology and hydrogen-bond directionality in G-quartets.

