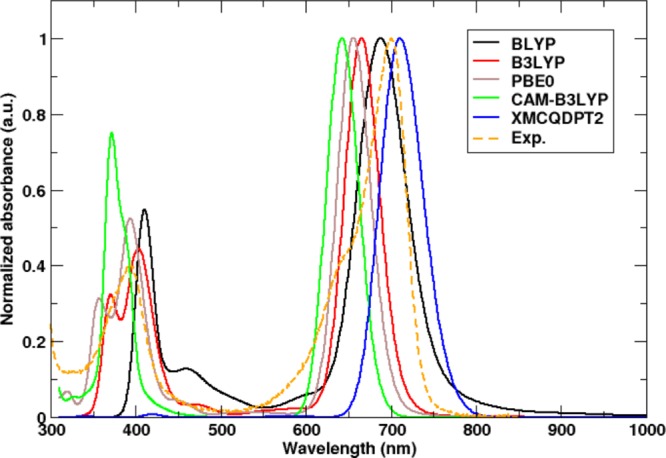
Figure 4.

QM/MM UV/vis-absorption spectra of DrBphP evaluated at the TDDFT level with various DFT functionals and at the XMCQDPT2 level of theory in the Pr state. The experimental spectrum is shown in dashed orange lines, with a Q-band peak at 700 nm. The best agreement is obtained with the BLYP functional and XMCQDPT2 method with an absorption maxima at 692 nm (black line) and 708 nm (blue line), respectively.
