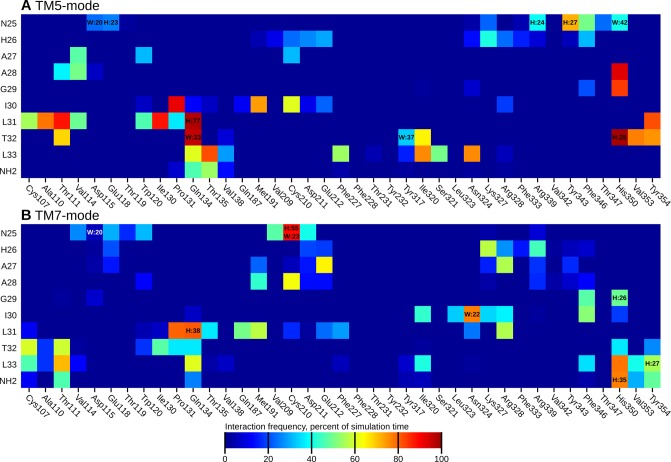
Figure 5.
Heatmap of binding interactions of the peptide C-terminus, averaged across all simulations sharing the same binding mode (1–4 for TM5-mode, 5–8 for TM7-mode). The heatmaps display the fraction of simulation time that any interatomic distance was below 4 Å. H:xx denotes the presence of a hydrogen bond and W:xx the presence of a water-mediated hydrogen bond. These are shown only when the frequency was over 20%.

