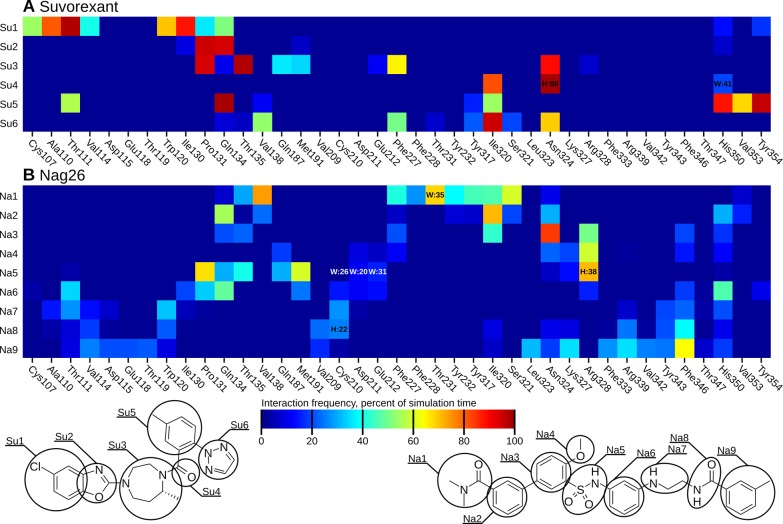
Figure 9.
Heatmap of binding interactions of the small molecular ligands. For the mapping, the small molecules were divided into groups as displayed below the heatmaps. The heatmaps display the fraction of simulation time that any interatomic distance was below 4 Å. H:xx denotes the presence of a hydrogen bond and W:xx the presence of a water-mediated hydrogen bond. These are shown only when the frequency was over 20%.

