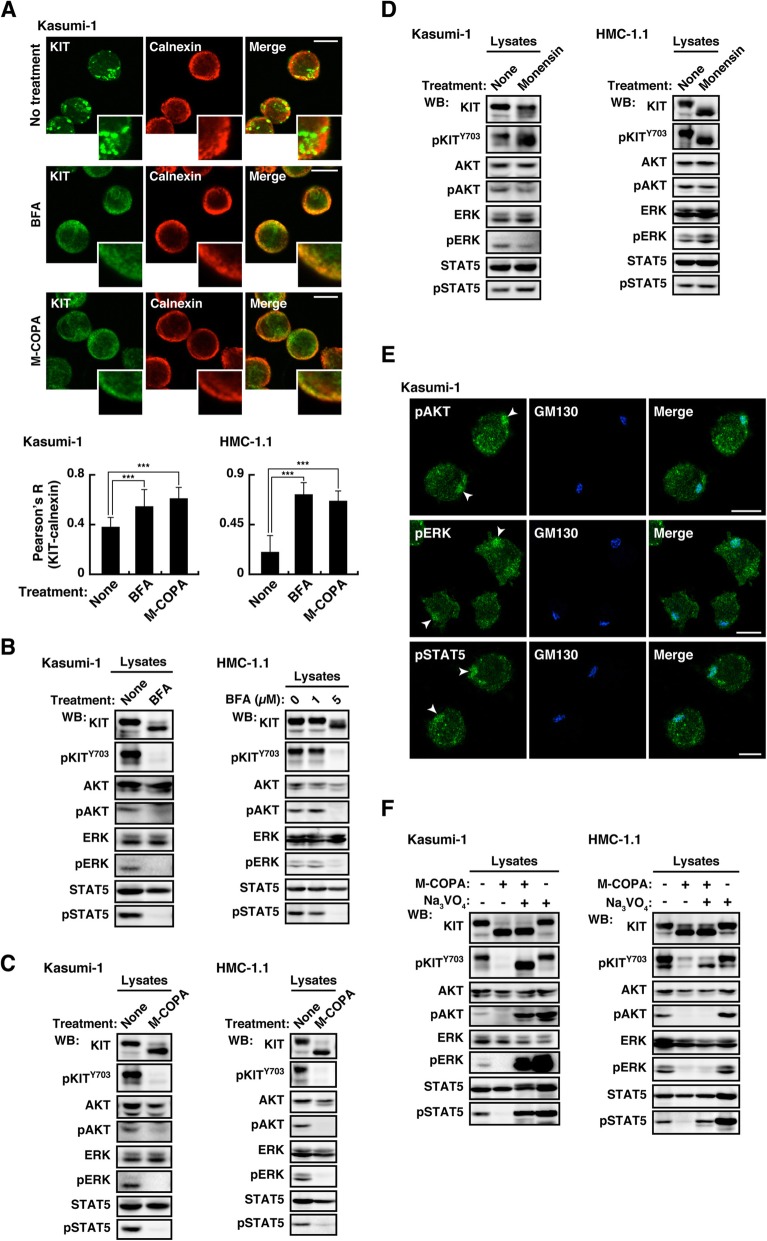
Fig. 5.
In Kasumi-1 and HMC-1.1, KIT activates downstream pathways on the Golgi apparatus. a Kasumi-1 cells were cultured for 12 h in the presence of 1 μM BFA or 1 μM M-COPA (inhibitors of ER export to the Golgi) and immunostained for KIT and calnexin (ER marker, red). Bars, 10 μm. Pearson’s R correlation coefficients were calculated by analyzing the intensity of KIT vs. calnexin. The right graph shows Pearson’s R (KIT-calnexin) for HMC-1.1 cells treated with 5 μM BFA or 1 μM M-COPA for 16 h. Results are means ± s.d. (n = 14~20). ***P < 0.001. b-d Kasumi-1 cells were treated for 12 h with 1 μM BFA, 1 μM M-COPA, or 250 nM monensin (an inhibitor of Golgi export to the PM). HMC-1.1 cells were treated with 1~5 μM BFA, 1 μM M-COPA for 16 h, or 250 nM monensin for 24 h. Lysates were immunoblotted. e Kasumi-1 cells were immunostained for phospho-AKT (pAKT, green), pERK (green), pSTAT5 (green), and GM130 (Golgi marker, blue). Bars, 10 μm. Arrowheads indicate the Golgi region. f Cells were treated with 1 μM M-COPA for 12 h (Kasumi-1) or 16 h (HMC-1.1), including 3 mM Na3VO4 (a PTP inhibitor) during the last 3 h, then immunoblotted

