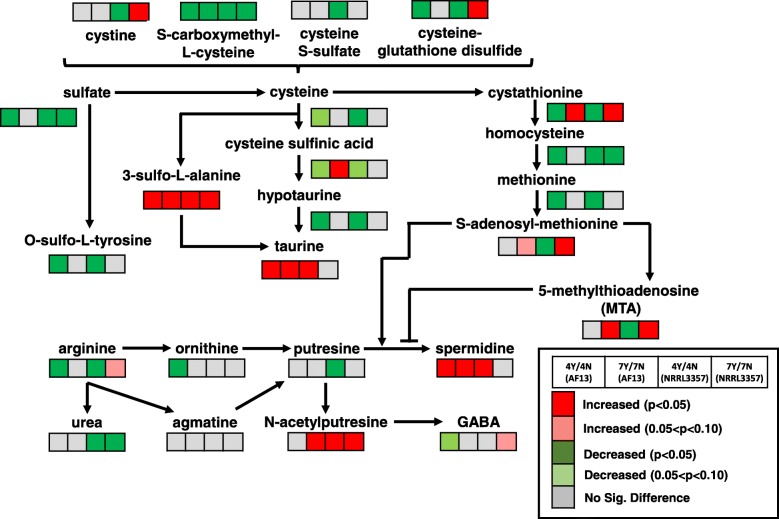
Fig. 4.
Differential accumulation of compounds involved in polyamine and sulfur metabolism. Heatmaps located at each metabolite represent the changes in metabolite accumulation in response to oxidative stress in AF13 and NRRL3357 at 4 and 7 DAI. Red and green indicate significant increases and decreases in metabolite levels, respectively (p < 0.05). Light red and light green indicate marginally significant increases and decreases in metabolite levels, respectively (0.05 < p < 0.10). Grey represents no significant changes

