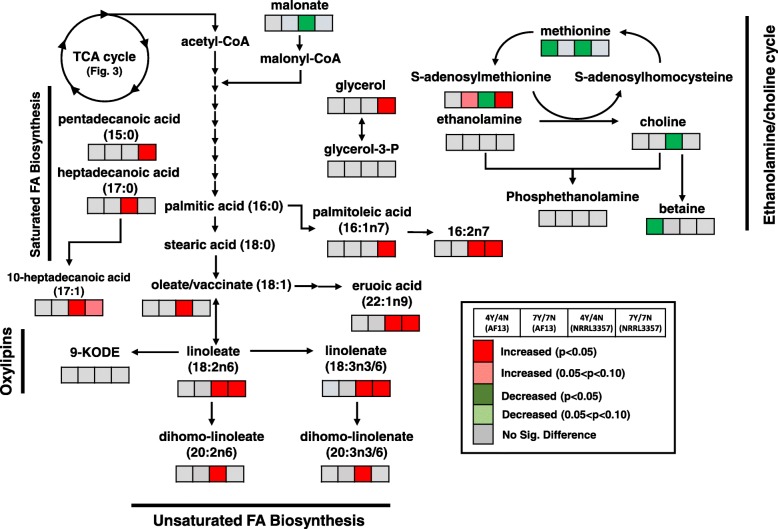
Fig. 5.
Differential accumulation of compounds involved in lipid metabolism. Heatmaps located at each metabolite represent the changes in metabolite accumulation in response to oxidative stress in AF13 and NRRL3357 at 4 and 7 DAI. Red and green indicate significant increases and decreases in metabolite levels, respectively (p < 0.05). Light red and light green indicate marginally significant increases and decreases in metabolite levels, respectively (0.05 < p < 0.10). Grey represents no significant changes

