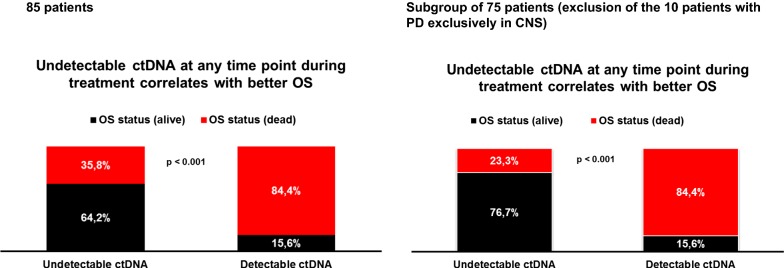
Fig. 4.
Survival difference between the group of patients who had at least one undetectable ctDNA value during follow up compared with the patients who had ctDNA detectable in the plasma at each time point. Bar diagrams indicating survival status using an extended multivariable Cox model in the overall population (n = 85) and in the defined subgroups (excluding patients with exclusively CNS PD; n = 75) where undetectable ctDNA during the follow-up was introduced in the model as a time-dependent variable using the time to the first occurrence

