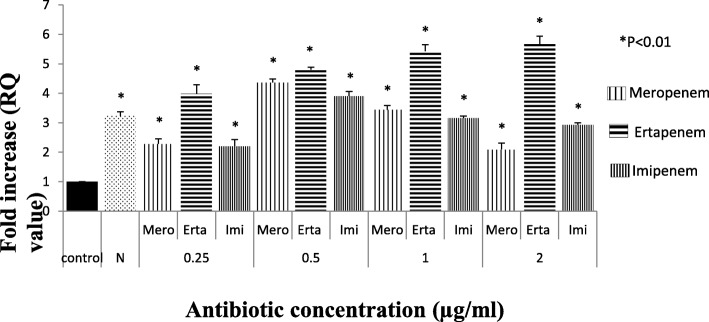
Fig. 2.
Expression of AcrA gene of test isolate under Carbapenem stress relative to Escherichia coli ATCC 25922. (The value against each bar is the average RQ value of all the test isolates). Footnote: The RQ values mentioned are the average of all the test isolates (representatives of all 16 clusters) when tested in triplicate. N = Isolate in normal condition without stress, C= Control (E. coli ATCC 25922) * represents P < 0.01

