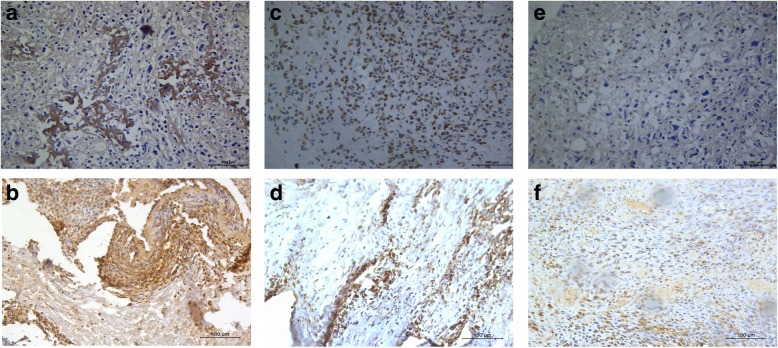
Fig. 1.
Representative immunohistochemical staining of TfR1 and VEGF. a High expression of TfR1 in OS. c Moderate expression of TfR1 in OS. e Low expression of TfR1 in OS. b High expression of VEGF in OS. d Moderate expression of VEGF in OS. f Low expression of VEGF in OS. The cells with positive expression were stained brown

