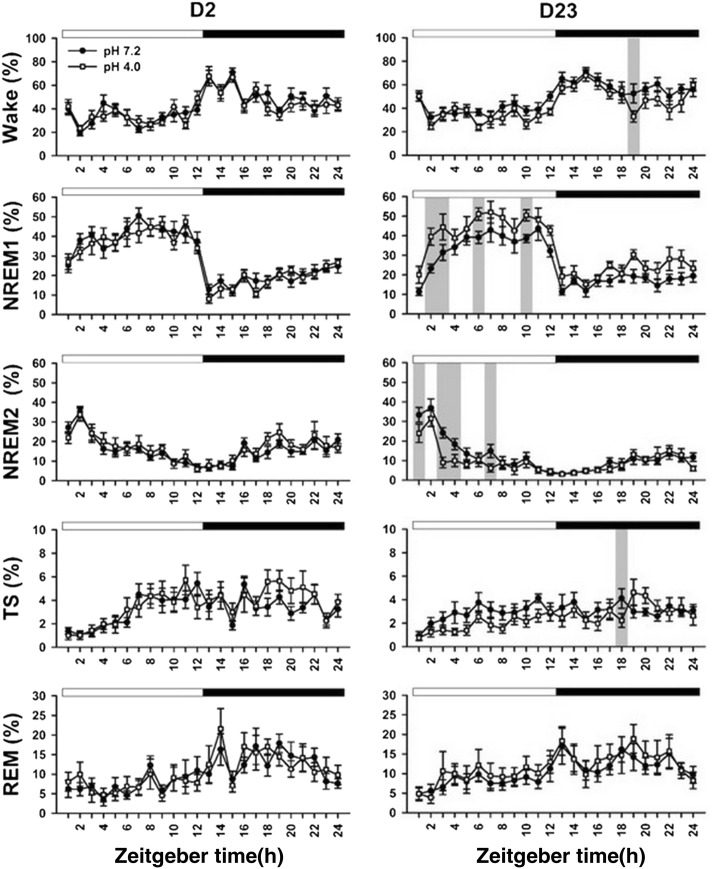
Fig. 3.
Changes of 5 wake–sleep stages per hour in the light and dark periods at days 2 and 23. Statistical significance between the vehicle group (filled circle) and acid group (open square) is indicated by gray bar. Light and dark periods are indicated with open horizontal bar and filled horizontal bar at the top of each subplot, respectively. Time is modified as zeitgeber time

