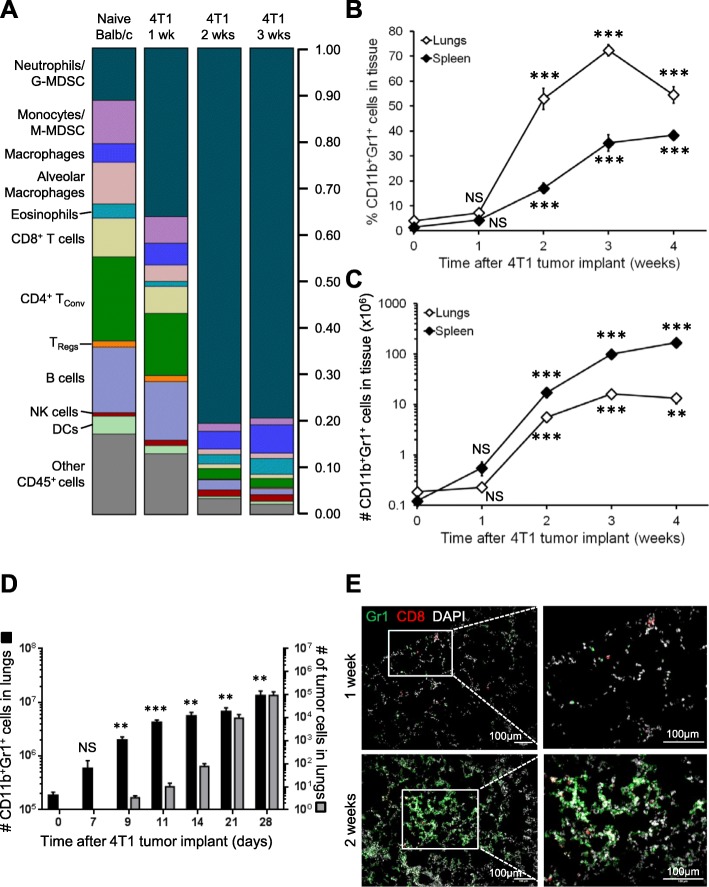
Fig. 1.
CD11b+Gr1+ cells accumulate in the lungs and spleens of 4T1 tumor-bearing mice. a Area plot illustrating mass cytometry time-of-flight (CyTOF) analysis of the proportion of various viable immune cell subsets recovered from the lungs of naïve mice or mice 1–3 weeks after orthotopic 4T1 mammary tumor implant. b Fraction of CD11b+Gr1+ cells recovered from the lungs and spleens of mice with 4T1 primary tumors. c Number of CD11b+Gr1+ cells in the lungs and spleens of mice with 4T1 primary tumors. Data are mean ± SEM with 5–15 mice per time point; significance compared to time 0. d Comparison between the numbers of CD11b+Gr1+ cells (left axis) and 4T1 tumor cells (right axis) in the lungs of 4T1 tumor-bearing mice with time after implant. Note different log scales on each axis; data are mean ± SEM with 4–6 mice per time point; significance compared to time 0. e Representative immunofluorescent images of lungs stained with Gr1 (green), CD8 (red), and DAPI (pseudo-colored white) from the lungs of mice 1 or 2 weeks after orthotopic 4T1 tumor implant. Increased magnification of boxed areas shown on the right. Scale bars = 100 μm

