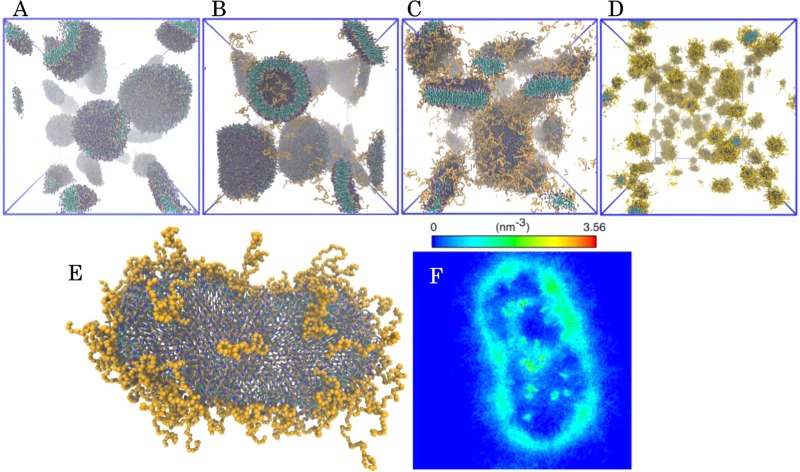
Figure 3.
Snapshots of the aggregates in 0.5 μs molecular dynamics simulations. Panel (A) shows pure DPPC, panel (B) DPPC with 2.2 mol % DSPE-PEG, panel (C) DPPC and 10.5 mol % DSPE-PEG, and panel (D) 50 mol % PEGylated lipid. Panel (E) shows a detailed structure of a bicelle of 1050 molecules containing 10.5 mol % DSPE-PEG, and panel (F) is the DSPE lipid density profile of the same bicelle.

