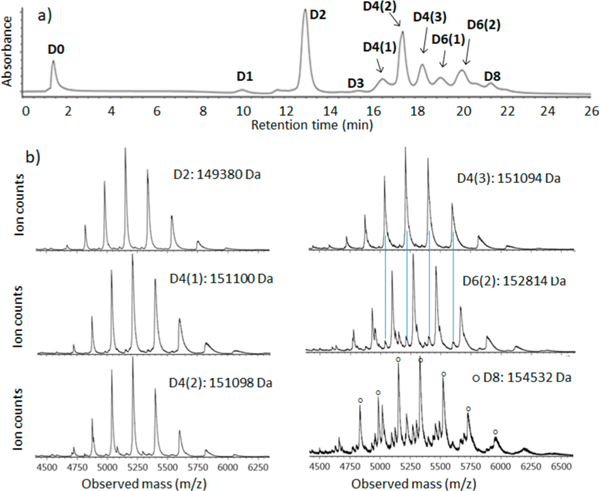
Figure 4.

(a) nRPLC of the AbbVie model ADC Ab095-PZ, with peaks labeled based on the mass spectra. Gradient: 0 to 4.5% IPA/water over 3 min, then 4.5 to 50% IPA/water over 20 min. Detection at 280 nm. (b) Raw mass spectra for peaks as labeled, with the molecular weight based on deconvoluted mass spectra for peak ID. The blue lines show that extra peaks are from overlap.
