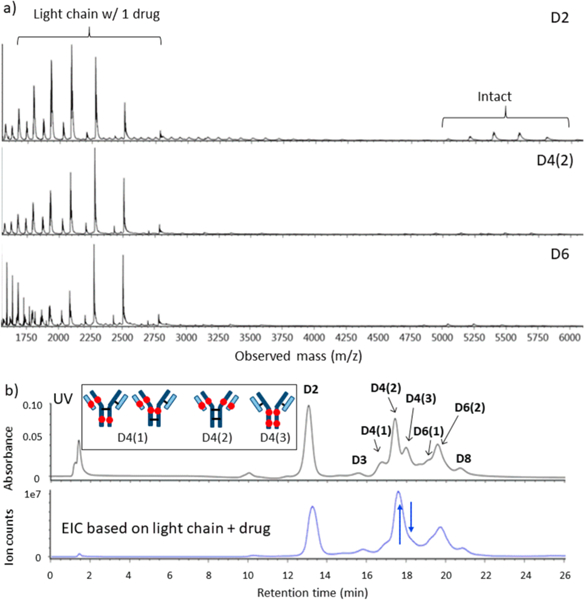
Figure 8.

LCMS data for brentuximab vedotin, analogous to Figure 5. (a) Full-range raw mass spectra show even stronger signals for light chain+drug than observed for the AbbVie model ADC. (b) Chromatogram for UV detection (top) approximately tracks that of EIC for signal of light chain+drug, again indicating light chain+drug dissociated after separation. Again, the blue arrows show two peaks that changed intensities, and the inset depicts the structures for the D4 isomers that are consistent with these changes.
