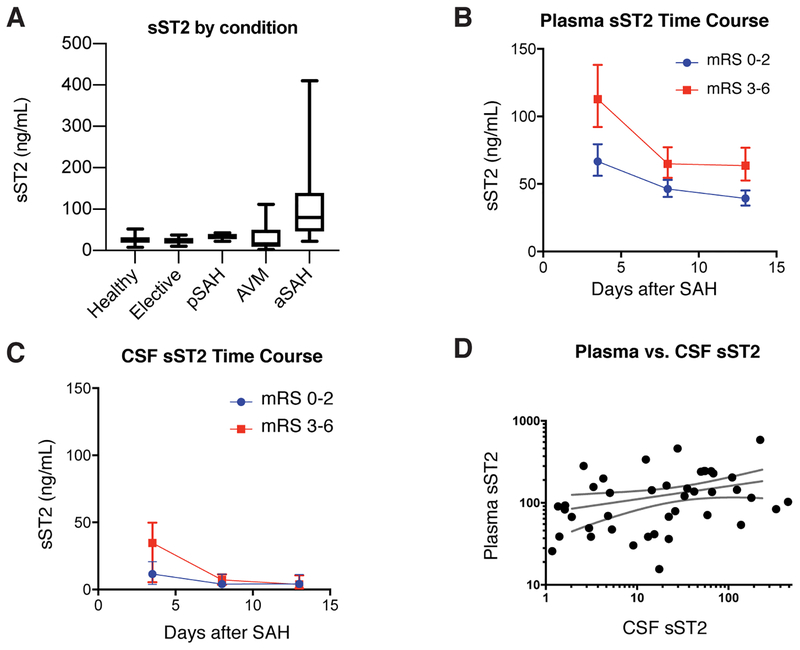
Figure 1.
Plasma and CSF sST2 in the Boston Cohort. A) Plasma sST2 is elevated in those patients with aneurysmal SAH compared to those with arteriovenous malformation, perimesencephalic pattern SAH, patients undergoing elective clipping of an unruptured aneurysm, or healthy volunteers (p<0.0001). B) Plasma sST2 is associated with outcome, with significantly higher sST2 in those with poor (mRS 3–6, red squares) compared to good outcome (mRS 0–2, blue circles) using a linear mixed effects model (β = 0.54 [95% CI 0.25 to 0.83], p < 0.001). Markers indicate mean with error bars showing standard deviation. C) A similar pattern was seen in CSF sST2 levels, but there was no significant difference based on outcome (β = 0.61 [95% CI −0.43 to 1.64], p = 0.25). D) Plasma and CSF sST2 are positively correlated (Spearman’s r = 0.37, p = 0.012).

