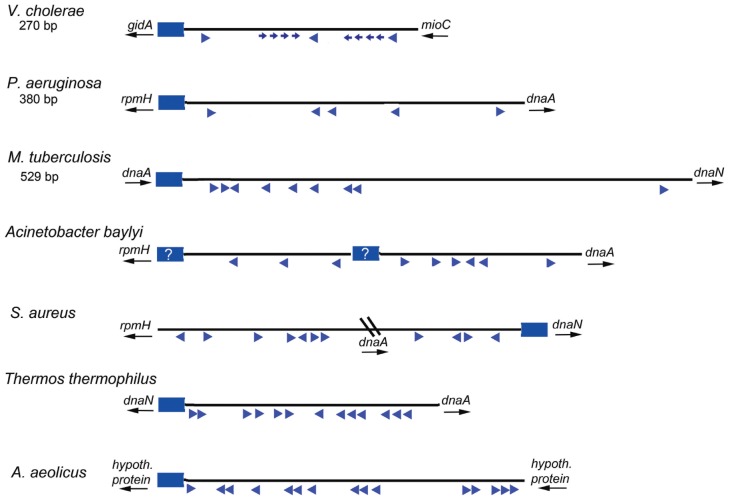
FIGURE 4.
Maps of several bacterial replication origins. Origins from diverse bacteria show many possible configurations. Flanking genes are shown for each origin region, with arrows indicating direction of transcription. The DUE regions for each origin shown by blue rectangles; a question mark is placed if the DUE location is ambiguous. Relative locations of DnaA binding sites are shown by blue arrowheads. Smaller arrows indicate know lower affinity sites. The direction of the arrows indicates the likely orientation of the arginine finger when DnaA is bound.

