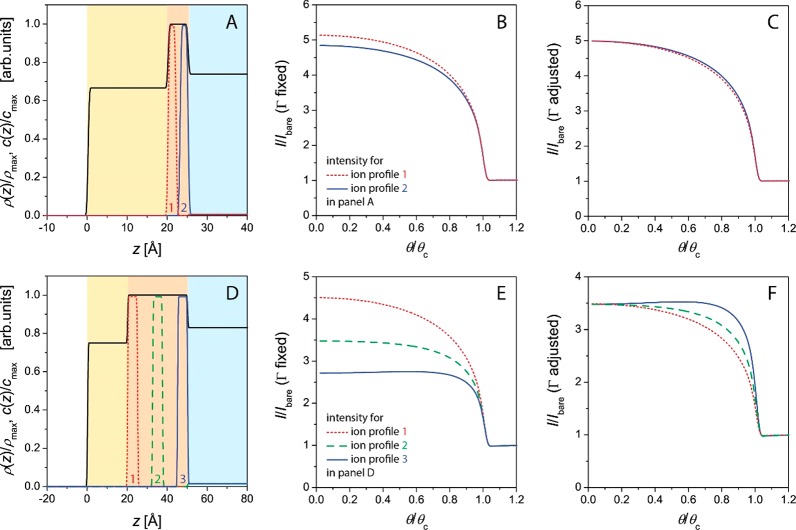
Figure 2.
Various modeled ion depth profiles c(z) in lipid monolayers with thin (A) and thick (D) hydrated headgroup regions. The solid black line indicates the electron density profiles within a slab model description, and cmax and ρmax denote the maximal values of c(z) and ρ(z), respectively. Panels B and E show the associated normalized angle-dependent fluorescence intensities as calculated with eq 2. Panels C and F show the curves that result when Γ is adjusted such that the intensities converge in the limit of small θ.

