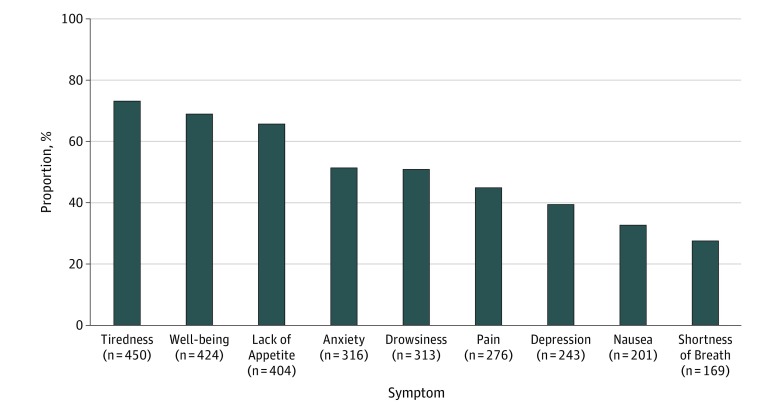
Figure 2. Proportion of Patients Reporting at Least 1 Moderate to Severe Edmonton Symptom Assessment Score (ESAS) Following Surgery.
Numbers under the x-axis indicate the total number of patients reporting at least 1 moderate to severe ESAS (>4) for each symptom while numbers within bars represent the proportion (%) of patients within the cohort reporting at least 1 moderate to severe ESAS for each symptom (N = 615).

