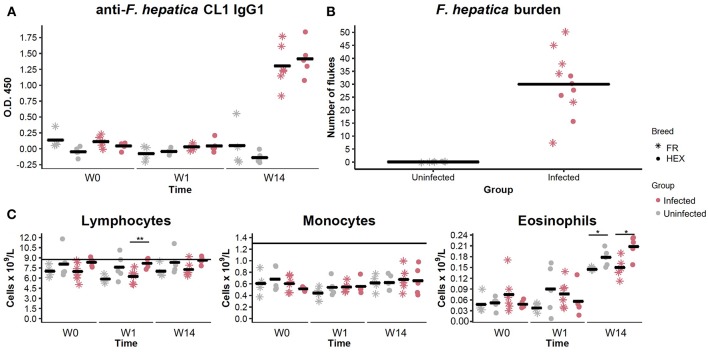
Figure 2.
Evaluation of anti Fasciola hepatica Cathepsin L1 IgG1 antibodies in uninfected (shapes in gray) and infected (shapes in pink) animals by ELISA at week 0 (W0), 1 week (W1), and 14 weeks (W14) post-experimental infection. Each dot and star represents optical density (O.D.) values at 450 nm for each Holstein-Friesian crossbred and Holstein-Friesian individual, respectively. Horizontal lines represent the mean for each group and time point (A). Fluke burden found in livers and bile ducts of uninfected and infected animals 15 weeks post-infection. Each star represents numbers of F. hepatica flukes for each Holstein-Friesian animal. Each dot represents numbers of F. hepatica flukes for each Holstein-Friesian crossbred animal. Horizontal lines represent the mean for each group (B). Dynamics of the different PBMC sub-populations (lymphocytes, monocytes, and eosinophils) in uninfected (gray) and infected (pink) animals at W0, W1, and W14. Each dot and star represent absolute values that are expressed in cells × 109/L for each Holstein-Friesian crossbred and Holstein-Friesian individual, respectively. Horizontal line represents the mean for each group and time point. Dots and stars located above the horizontal line indicate that values are above the standard reference range (C). *P = 0.08 **P = 0.009.

