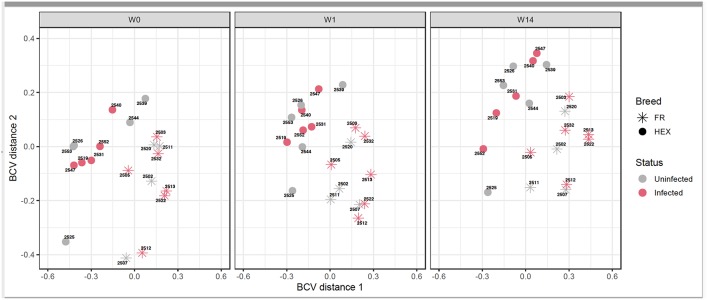
Figure 3.
Multidimensional scaling of uninfected and infected Holstein-Friesian and Holstein-Friesian crossbred animals at week 0 (W0), week 1 (W1), and week 14 (W14) post F. hepatica infection. The BCV distance 1 (x-axis) and 2 (y-axis) represent the directions that separate the gene expression of the samples to the greatest extent.

