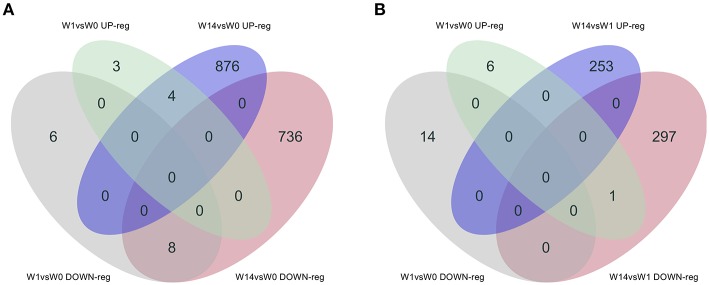
Figure 5.
Venn diagrams showing the numbers of DEGs identified in PBMC and their direction of expression driven specifically by F. hepatica infection. Comparison of DEGs from W1 vs. W0 with W14 vs. W0 (A) and W1 vs. W0 with W14 vs. W1 (B). Downregulated genes are shown in gray and pink, upregulated genes in green and blue.

