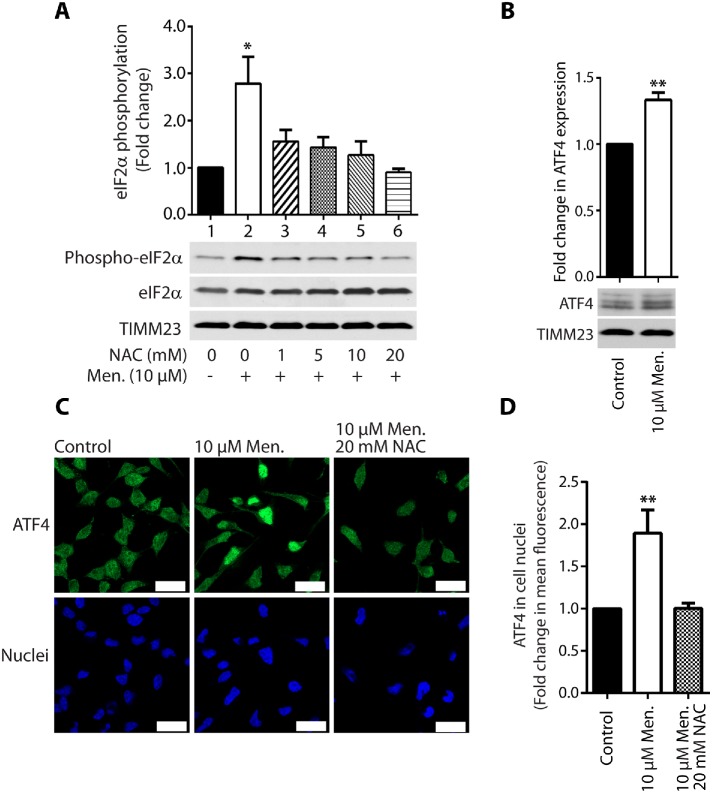
FIGURE 3:
Increase in mROS production upon treatment of cells with menadione induced the integrated stress response. (A) Phosphorylation of eIF2α (Ser51) protein upon treatment of HEK293 cells for 2 h with menadione in the presence of NAC as indicated. Mean ± SEM. n = 3. (B) Fold change in ATF4 expression in HEK293 cells treated for 2 h with menadione as indicated. Mean ± SEM. n = 3. (C) Localization of ATF4 in HeLa cells. The cells were treated with vehicle (Control), menadione for 2 h, and NAC for 2 h in the presence of menadione as indicated. Nuclei were stained with DAPI. Scale bar = 20 μM. n = 2. (D) ATF4 in cell nuclei. Quantification of fold change in mean fluorescence in cell nuclei in experiment C. Mean ± SEM. n = 9. Men, menadione; NAC, N-acetyl-l-cysteine. *p < 0.05; **p < 0.01 by Student’s t test.

