FIGURE 3:
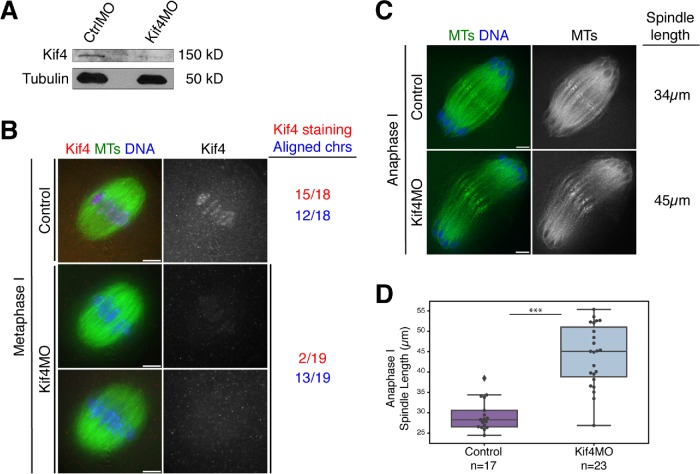
Kif4 knockdown causes anaphase spindle defects. (A) Western blot showing reduced Kif4 protein levels after microinjection of Kif4 MO. Tubulin was used as a loading control. Each lane contains 25 GV oocytes. (B) Metaphase I oocytes stained for Kif4 (red), microtubules (green), and DNA (blue). Kif4 fluorescence is reduced after microinjection of Kif4 morpholino (Kif4 MO) in most oocytes, but there were no obvious congression defects. Quantification of 18 control and 19 Kif4 MO metaphase I spindles for Kif4 staining levels (red) and chromosome alignment (blue) is shown to the right of the images. Images are single z-slices from the center of the spindle stack. (C) Anaphase I spindles stained for microtubules (green) and DNA (blue). Kif4 knockdown causes elongated anaphase spindles. The lengths of the representative spindles shown are noted on the right of the images. (D) Quantification of anaphase I spindle lengths in control compared with Kif4-depleted oocytes. The control category represents a mixture of both uninjected oocytes (n = 8) and oocytes injected with a control MO (n = 9); we did not detect a significant difference (by the Kolmogorov–Smirnov test) in the spindle lengths in these two control categories, so they were pooled in the graph. For this analysis, only spindles where chromosomes were near the ends of spindle microtubules were used for consistency in staging. Average anaphase I spindle lengths were 29.8 µm ± 1.1 (n = 17) for control oocytes and 46.8 µm ± 1.3 (n = 23) for Kif4MO-injected oocytes. Scatter plot overlaid on box plot shows individual spindle length measurements. Three asterisks denote p < 0.0005. Bars = 5 µm.

