FIGURE 5:
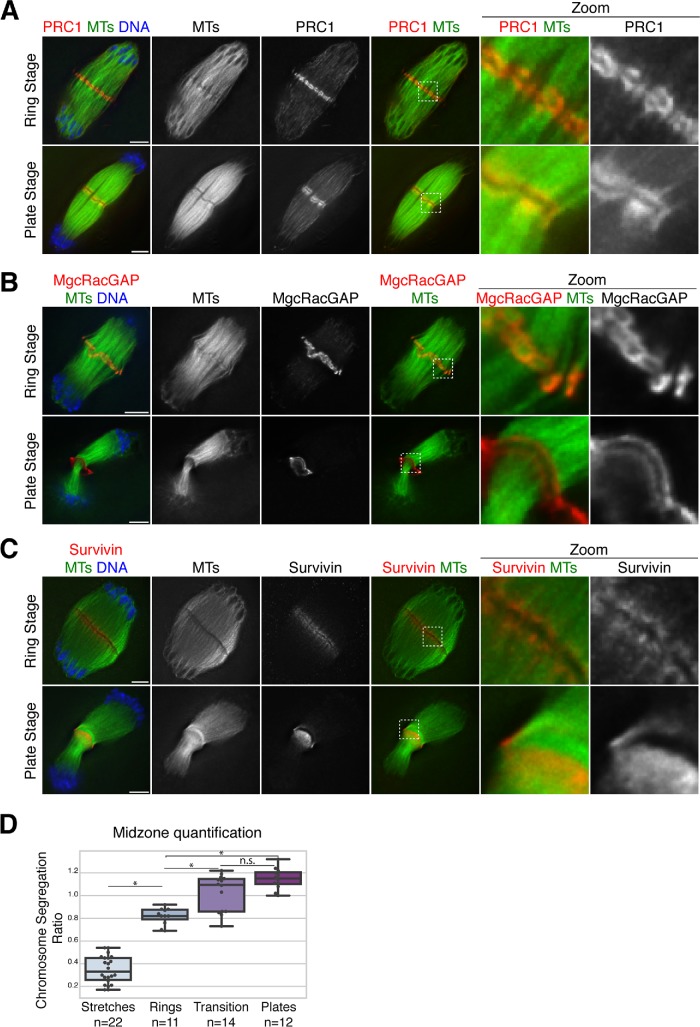
Midzone organization in anaphase oocyte spindles. (A, B) Anaphase spindles stained for microtubules (green), DNA (blue), and PRC1 (red, panel A) or centralspindlin complex component MgcRacGAP (red, panel B). Both PRC1 and MgcRacGAP have similar localization to Kif4, forming ring-like structures and transitioning to a plate stage. (C) Anaphase spindles stained for the CPC component survivin (red), microtubules (green), and DNA (blue). In contrast to Kif4/PRC1/MgcRacGAP, survivin does not appear to form distinct structures and instead localizes adjacent to the dark zone region where these other proteins reside. Note that even though we were not able to costain with an antibody that would mark the rings, we were able to categorize the top spindle as “ring stage” by measuring the extent of chromosome segregation and confirming that this spindle was at a similar stage of anaphase as those that contain rings (analysis shown in Supplemental Figure S5B). Images in all panels are partial projections, chosen to highlight midzone features. (D) Quantification of midzone changes during anaphase progression. For each spindle, midzone organization was classified (i.e., whether midzone proteins Kif4, PRC1, or MgcRacGAP were in stretches on microtubules, in rings, in plates, or with a mixture of rings and plates in “transition”) and the stage of anaphase was determined by measuring the chromosome segregation ratio (calculated by dividing chromosome segregation distance by spindle length). Average segregation ratio for stretches is 0.35 ± 0.03 (n = 22), for rings is 0.82 ± 0.02 (n = 11), for transition is 1.02 ± 0.04 (n = 14), and for plates is 1.15 ± 0.03 (n = 12); this trend suggests that these stages are sequential and the segregation ratio can distinguish between stages (p = 1.6e-26, one-way ANOVA). Bonferroni adjusted p < 0.05 has a single asterisk; adjusted p > 0.05 denoted n.s.

