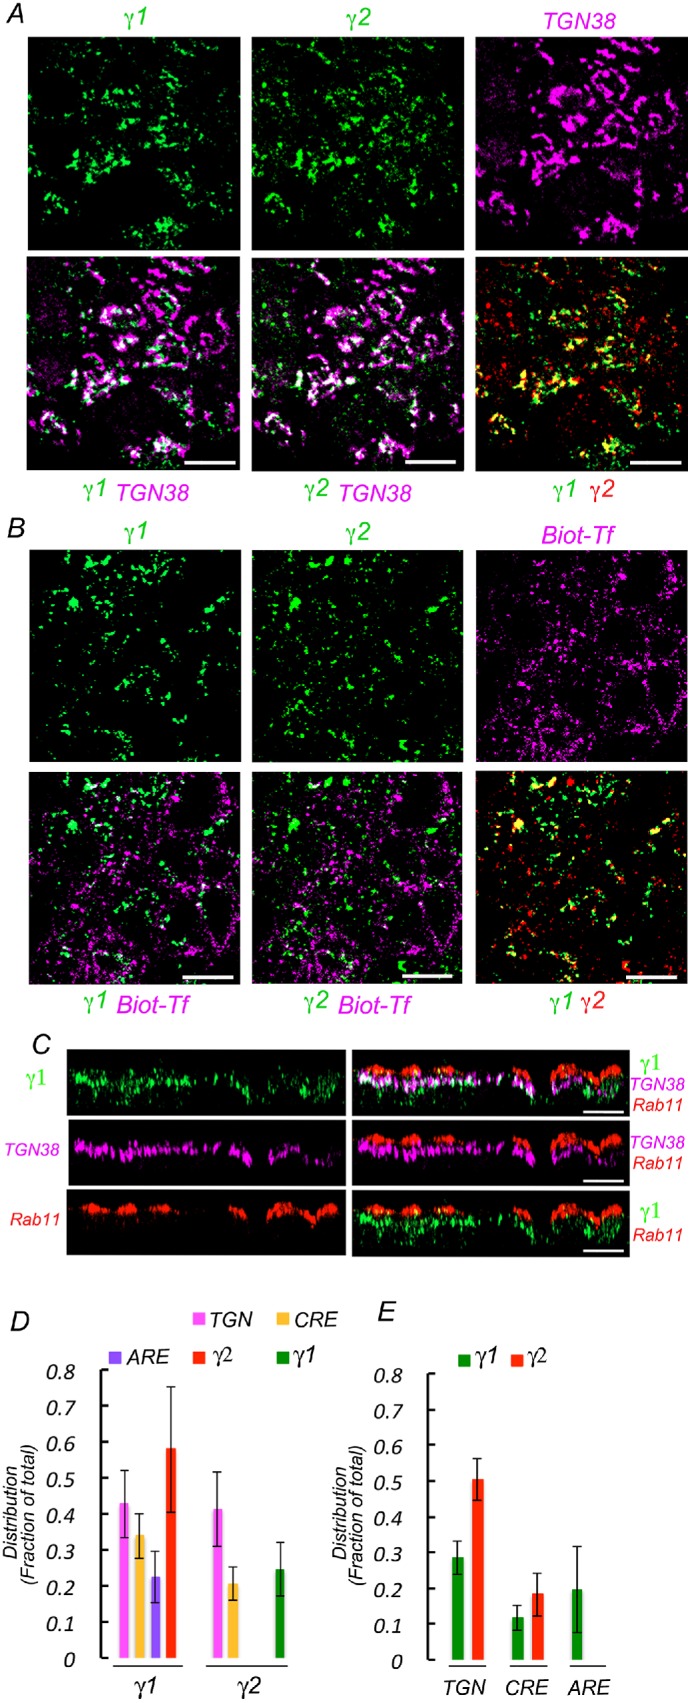
FIGURE 10:

Compartmental distribution of γ1 and γ2 studied by quantitative immunofluorescence colocalization. Wild-type MDCK cells were fixed and processed for immunofluorescence using a mouse antibody against γ1 adaptin and a rabbit antibody against γ2 adaptin and different antibodies against TGN (TGN38) and ARE (Rab11) markers. Top panels display individual markers; bottom panels display pairs of colocalized markers. (A) Colocalization with TGN marker. Note areas of extensive colocalization between γ1, γ2, and TGN 38, as well as colocalization between γ1 and γ2. (B) Colocalization with CRE marker. For CRE labeling, cells were loaded with biotinylated transferrin for 90 min before fixation and processing for γ1 and γ2 immunofluorescence as described above. Subsequently, the cells are decorated with Alexa 647–streptavidin. (C) Colocalization with ARE marker. Cells are processed with antibody against γ1 adaptin and Rab 11, followed by the corresponding secondary antibodies. γ2 localization studies were prevented by lack of appropriate antibodies. Displayed images represent x-z projections of 15 slices. Note the apical localization of ARE with respect to the TGN and the extensive colocalization of γ1 and TGN. There is little colocalization of γ1 with ARE, likely reflecting projections of TGN fragments at that level. (D) Bar graph quantification of the colocalization of γ1 and γ2 with TGN, CRE, and ARE. (E) Bar graph quantification of the colocalization of TGN, CRE, and ARE with γ1 and γ2.
