FIGURE 1:
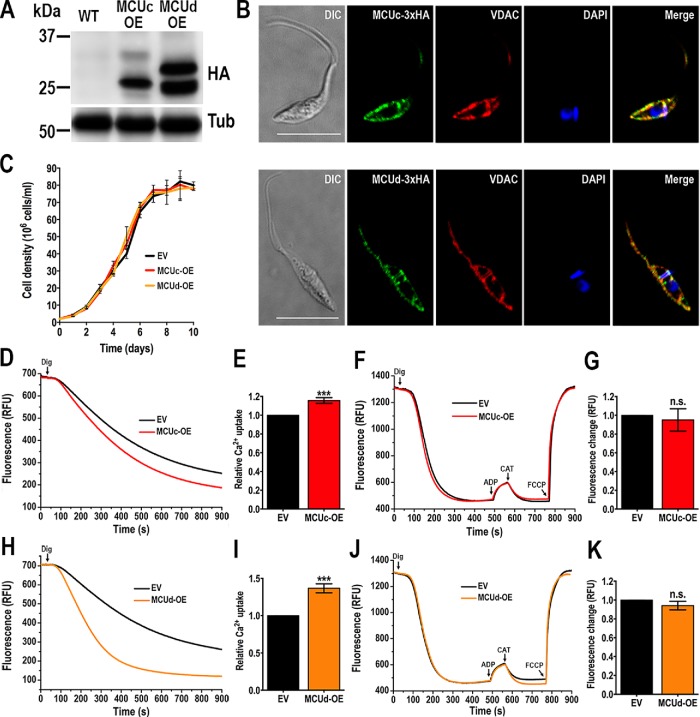
Analysis of TcMCUc and TcMCUd overexpressing cells. (A) TcMCUc-3xHA (MCUc-OE) and TcMCUd-3xHA (MCUd-OE) overexpression was confirmed by Western blot analysis using anti-HA monoclonal antibodies. WT cells were used as control cell line. α-Tubulin (Tub) was used as loading control. (B) IFA showed colocalization between the green signal of TcMCUc-3xHA (top panel) or TcMCUd-3xHA (bottom panel) and VDAC (red) in the merged image (yellow). DAPI staining (blue) and DIC images are also shown. Scale bars = 10 μm. (C) Growth of control (EV, epimastigotes transfected with pTREXn empty vector), and TcMCUc (MCUc-OE) and TcMCUd (MCUd-OE) epimastigotes in LIT medium. No significant differences in growth rates were found using one-way ANOVA with multiple comparisons. (D) Representative traces of Ca2+ uptake by DIG-permeabilized TcMCUc-OE (MCUc-OE) and control (EV) epimastigotes in relative fluorescence units (RFU). The reaction was started after adding 50 μM DIG in the presence of 20 μM free Ca2+, 5 mM succinate and 0.5 μM Calcium Green-5N probe in reaction buffer. (E) Quantification of data from three experiments as shown in D. (F) Changes in mitochondrial membrane potential (ΔΨm) of DIG-permeabilized epimastigotes as detected by changes in safranine O fluorescence in EV, control cells, and MCUc-OE, TcMCUc-OE cells. Cells (5 × 10⁷) were added to the reaction buffer (2 ml) containing 0.2% BSA, 5 mM succinate, 50 μM EGTA, and 5 μM safranine O. The reaction was started with 50 μM DIG, and 250 μM ADP, 1.5 μM CAT, and 4 μM FCCP were added where indicated. (G) Changes in safranine O fluorescence after addition of ADP to cells used as in F. (H) Representative traces of Ca2+ uptake by DIG-permeabilized TcMCUd-OE (MCUd-OE) and control (EV) epimastigotes in RFU. The reaction was started after adding 50 μM DIG using the same experimental conditions and additions as D. (I) Quantification of data from three experiments as shown in H. (J) Changes in ΔΨm of DIG-permeabilized epimastigotes as detected by changes in safranine O fluorescence in EV, control cells, and MCUd-OE, TcMCUd-OE cells. The reaction was started after adding 50 μM DIG using the same experimental conditions and additions as in F. (K) Changes in safranine O fluorescence after addition of ADP to cells as used in J. In E, G, I, and K, values are means ± SD, n = 3; ns, no significant differences; ***P < 0.001 (Student’s t test).

