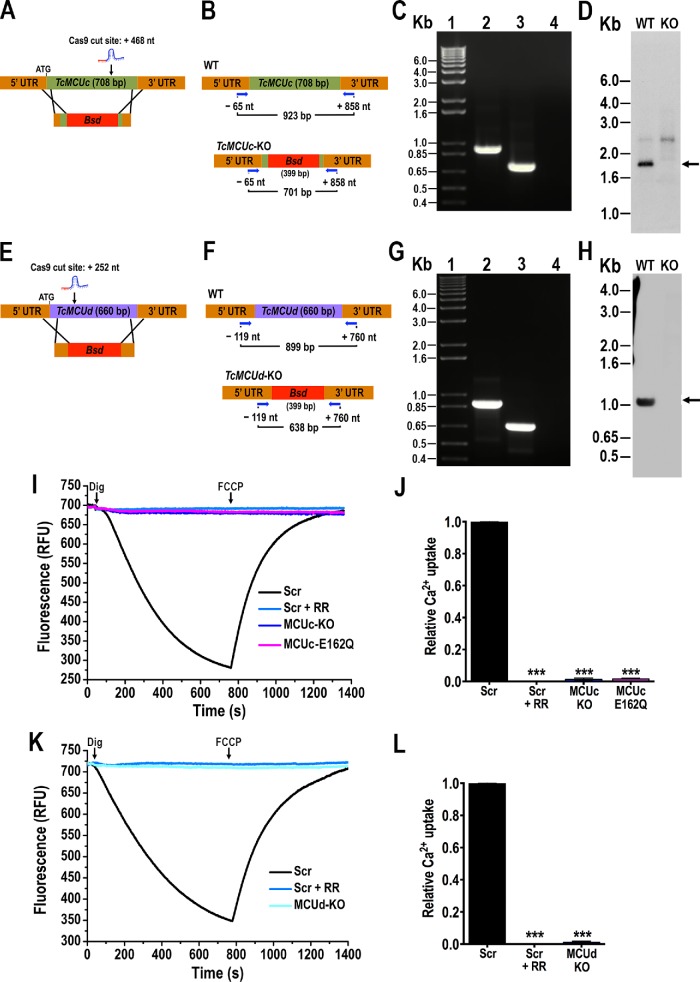
FIGURE 2:
Ca2+ uptake by TcMCUc and TcMCUd KOs. (A) Schematic representation of the strategy used to generate a TcMCUc-KO mutant by CRISPR/Cas9-induced homologous recombination. A double-stranded gDNA break was produced by Cas9 at nt +468 of the TcMCUc ORF (708 base pairs). DNA was repaired with a Bsd cassette containing 100–base pair homologous regions spanning from nt -44 to +56 and from nt +677 to +776 of the TcMCUc locus. (B) Primers (arrows) that were used to verify gene disruption by PCR. The intact locus generates a PCR product of 923 base pairs, while the disrupted locus generates a fragment of 701 base pairs. (C) TcMCUc was disrupted at its genomic locus in the KO cell line. Lanes: 1, 1-kb plus ladder; 2, WT; 3, TcMCUc-KO mutant cell line; 4, PCR negative control. (D) Southern blot analysis of WT and TcMCUc-KO (KO) epimastigotes. The blot was hybridized with a 409–base pair biotin-labeled fragment of TcMCUc (nt +240 to +649). Arrow indicates the expected restriction band recognized by the probe. (E) Schematic representation of the strategy used to generate a TcMCUd-KO mutant by CRISPR/Cas9-induced homologous recombination. A double-stranded gDNA break was produced by Cas9 at nt +252 of the TcMCUd ORF (660 base pairs). DNA was repaired with a Bsd cassette containing 100–base pair homologous regions spanning from nt -100 to +1 and from nt +630 to +730 of the TcMCUd locus. (F) Primers (arrows) used to verify gene replacement by PCR. The intact locus generates a PCR product of 899 base pairs, while the disrupted locus generates a fragment of 638 base pairs. (G) TcMCUd was disrupted at its genomic locus by the Bsd gene in the KO cell line. Lanes: 1, 1-kb plus ladder; 2, WT; 3, TcMCUd-KO mutant cell line; 4, PCR negative control. (H) Southern blot analysis of WT and TcMCUd-KO (KO) epimastigotes. The blot was hybridized with a biotin-labeled probe corresponding to 435 base pairs of TcMCUd (nt +1 to +435). Arrow indicates the expected restriction band recognized by the probe. (I) Ca2+ uptake by DIG-permeabilized epimastigotes in RFU. Scr, cells transfected with scrambled sgRNA in the absence or presence of 5 μM ruthenium red (+ RR); MCUc-KO, TcMCUc-KO cells; MCUc-E162Q, TcMCUc-E162Q cells. The reaction was started after adding 50 μM DIG in the presence of 20 μM CaCl2. Where indicated, 4 μM FCCP was added. (J) Quantification of data from three experiments as shown in I. Relative Ca2+ uptake at 600 s compared with that of epimastigotes transfected with scrambled control. (K) Ca2+ uptake by DIG-permeabilized epimastigotes in RFU. Cells transfected with scrambled sgRNA (Scr) in the absence or presence of 5 μM ruthenium red (+ RR); MCUd-KO, TcMCUd-KO cells. The reaction was started after adding 50 μM DIG in the presence of 20 μM CaCl2. Where indicated, 4 μM FCCP was added. (L) Quantification of data from three experiments as shown in K. Relative Ca2+ uptake at 600 s compared with that of epimastigotes transfected with scrambled sgRNA. Values in J and L are mean ± SD (n = 3); ***P < 0.001; one-way ANOVA.

