FIGURE 3:
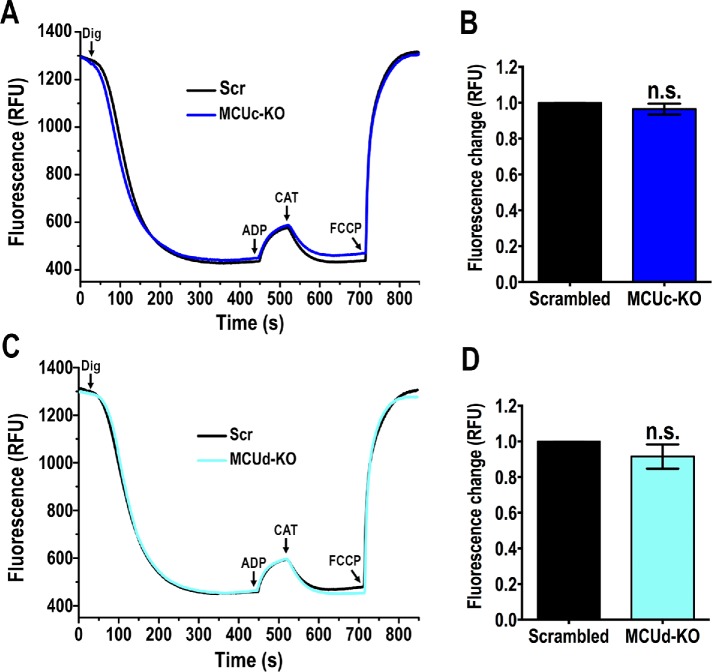
Mitochondrial membrane potential in TcMCUc and TcMCUd KOs. (A) Changes in mitochondrial membrane potential (ΔΨm) of DIG-permeabilized epimastigotes as detected by changes in safranine O fluorescence in cells transfected with scrambled sgRNA, Scr, and MCUc-KO, TcMCUc-KO cells. The reaction was started with 50 μM DIG, and 250 μM ADP, 1.5 μM CAT, and 4 μM FCCP were added where indicated. (B) Changes in safranine fluorescence after addition of ADP of cells as used in A. (C) Changes in ΔΨm of DIG-permeabilized epimastigotes as detected by changes in safranine O fluorescence in cells transfected with scrambled sgRNA (Scr), and MCUd-KO, TcMCUd-KO cells. The reaction was started after adding 50 μM DIG using the same experimental conditions and additions as in A. (D) Changes in safranine fluorescence after addition of ADP of cells as used in C. In B and D, values are mean ± SD, n = 3, ns, no significant differences (Student’s t test).

