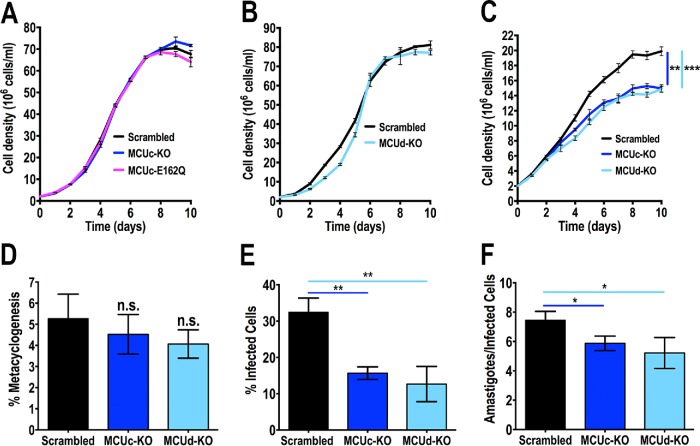
FIGURE 4:
Growth, metacyclogenesis, and infectivity of TcMCUc and TcMCUd KO cells. (A, B) Growth of control (scrambled), TcMCUc-KO, and TcMCUc-E162Q epimastigotes (A), and control and TcMCUd-KO cells in LIT medium (B). No significant differences in growth rates were found using one-way ANOVA with multiple comparisons or Student’s t test, respectively. (C) Growth of control (scrambled), TcMCUc-KO, and TcMCUd-KO epimastigotes in low-glucose LIT medium. One-way ANOVA with multiple comparisons was applied to growth rates calculated from each growth curve (**p < 0.01, ***p < 0.001). (D) Percentage of metacyclic trypomastigotes in epimastigote cultures after incubation in TAU 3AAG medium. Differentiation of epimastigotes to metacyclic trypomastigotes was quantified by staining with DAPI to distinguish the position of the kinetoplast by fluorescence microscopy. Values are mean ± SD (ns, no significant differences) with one-way ANOVA with multiple comparisons. (E, F) TcMCUc-KO and TcMCUd-KO trypomastigote infection of Vero cells. There were significant differences in the percentage of infected Vero cells at 4 h postinfection (E) as well as in the number of intracellular amastigotes per infected host cell observed 48 h postinfection (F) by both mutant cells. Values are mean ± SD; n = 3; *p < 0.05, **p < 0.01) (one-way ANOVA with Dunnett multiple comparisons).

