FIGURE 5:
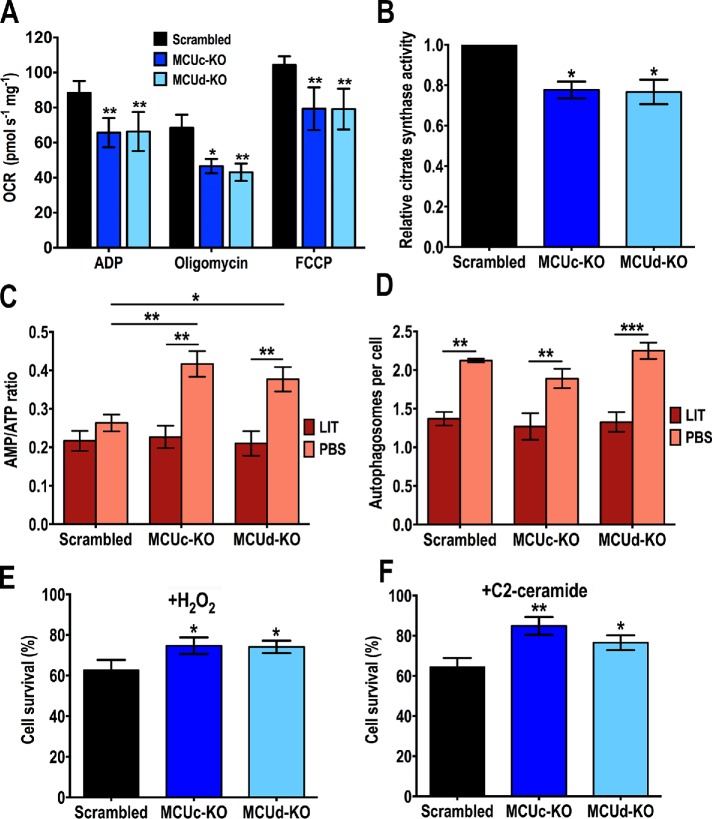
Phenotypic changes in TcMCUc and TcMCUd KO cells. (A) Respiration of TcMCUc and TcMCUd KO epimastigotes. OCR of DIG-permeabilized control (Scrambled, black bars), TcMCUc-KO (dark blue bars), and TcMCUd-KO (light blue bars) epimastigotes in the presence of succinate as substrate. Bar charts show OCR after the addition of 100 μM ADP (respiration stimulated by oxidative phosphorylation or OXPHOS), 1 μg/ml oligomycin (minimal respiratory rate), and 1.0 μM FCCP (maximal respiratory capacity). Values are mean ± SD; n = 3; *p < 0.05, **p < 0.01 (two-way ANOVA with Dunnett’s multiple comparisons test). (B) Relative citrate synthase activity of control (Scrambled), TcMCUc-KO (MCUc-KO), and TcMCUd-KO (MCUd-KO) epimastigotes. Values are mean ± SD, n = 3, *p < 0.05 (one-way ANOVA with multiple comparisons). (C) AMP/ATP ratios of control (Scrambled), TcMCUc-KO (MCUc-KO), and TcMCUd-KO (MCUd-KO) cells incubated in LIT medium or PBS for 16 h. (D) Number of autophagosomes per cell observed by fluorescence microscopy images of control (Scrambled), TcMCUc-KO (MCUc-KO), and TcMCUd-KO (MCUd-KO) epimastigotes labeled with anti-TcATG8.1 antibody after incubation in LIT medium or PBS for 16 h. In C and D, values are means ± SD, n = 3, *p < 0.05, **p < 0.01, ***p < 0.001. Statistical analyses were performed using two-way ANOVA with Sidak’s multiple comparisons test. (E, F) Cell viability on apoptotic challenge of control (Scrambled), TcMCUc-KO (MCUc-KO), and TcMCUd-KO (MCUd-KO) epimastigotes with H2O2 (E) and C2-ceramide (F). The results are expressed as the percentage of growth compared with untreated cultures. Values are means ± SD, n = 3, *p < 0.05, **p < 0.01. Statistical analyses were performed using one-way ANOVA with multiple comparisons.

