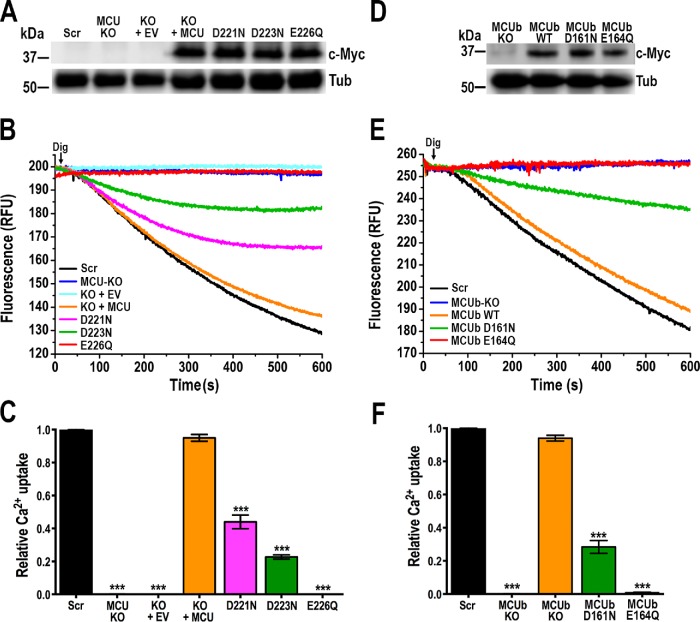
FIGURE 6:
Functional mutagenesis of critical amino acid residues at the selectivity filter of TcMCU and TcMCUb. (A) Western blot analysis of total protein extracts of control (Scr) cells, TcMCU-KO (MCU KO), TcMCU-KO plus EV (KO + EV), TcMCU-KO plus TcMCU (KO + MCU), TcMCU-KO plus TcMCUD221N (D221N), TcMCU-KO plus TcMCUD223N (D223N), and TcMCU-KO plus TcMCUE226Q (E226Q) epimastigotes using anti-c-Myc antibodies. Anti-tubulin antibodies (Tub) were used as a loading control. (B) Ca2+ uptake reconstitution in DIG-permeabilized epimastigotes. Experimental conditions were as in Figure 1D. (C) Quantification of data from three experiments as shown in B. Relative Ca2+ uptake at 500 s compared with controls (Scr). (D) Western blot analysis of total protein extracts of control and knock-in mutated cells, using anti-c-Myc antibodies. Anti-tubulin (Tub) antibodies were used as a loading control. (E) Ca2+ uptake in DIG-permeabilized control (Scr), TcMCUb-KO (MCUb-KO), and knock-in TcMCUbcontrol (MCUb WT), TcMCUbD161N (MCUb D161N) and TcMCUbE164Q (MCUb E164Q) epimastigotes. Experimental conditions were as in Figure 1D. (F) Quantification of data from three experiments as shown in E. Relative Ca2+ uptake at 500 s compared with controls (Scr). Values in C and F are means ± SD (n = 3); ***P < 0.001; one-way ANOVA.

