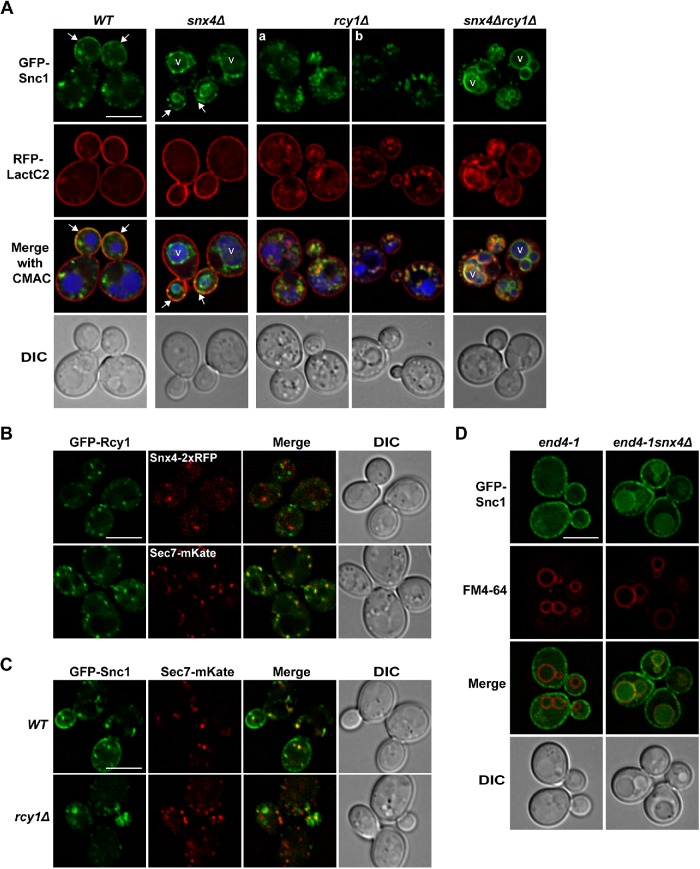
FIGURE 1:
Epistasis analysis of GFP-Snc1 trafficking pathways. (A) Micrographs of GFP-Snc1 and RFP-LactC2 coexpressed in wild-type and the indicated mutant cells. Arrows point to the plasma membrane of budding cells. Panel a shows a representative localization of GFP-Snc1 and RFP-LactC2 that accumulate near in or near the budding cell. Panel b shows an example where GFP-Snc1 compartments appear to be connected to PM invaginations, marked by RFP-LactC2. Vacuoles are visualized using CMAC. (B) Micrographs of rcy1Δ cells showing GFP-Rcy1 colocalization with Snx4-2xRFPor Sec7-mKate, Pearson’s correlations are Rave = 0.22 (n = 49), Rave = 0.64 (n = 43), respectively. (C) Micrographs of wild-type and rcy1Δ cells expressing GFP-Snc1 and Sec7-mKate are shown. (D) Micrographs of end4-1 and end4-1snx4Δ cells expressing GFP-Snc1 are shown. Vacuole membranes were visualized using FM4-64 dye. An approximate medial single Z section is shown unless otherwise indicated. Scale bars indicate 5 μm.

