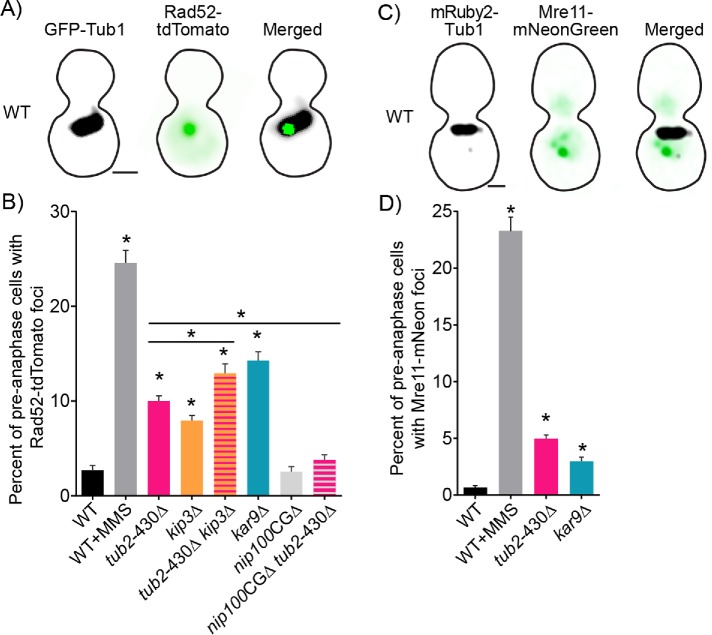
FIGURE 3:
Mutants with increased nuclear migration contain a higher frequency of cells with DSBs. (A) Representative image of a WT cell expressing GFP-Tub1 and Rad52 labeled with tdTomato. Bar, 1 µm. (B) The percentage of cells containing Rad52 foci in preanaphase of the cell cycle. Percentages are calculated by number of cells containing Rad52 foci divided by number of cells in preanaphase of the cell cycle. WT, n = 2581; WT MMS, n = 972; tub2-430∆, n = 2653; kip3∆, n = 2294; tub2-430∆ kip3∆, n = 1762; kar9∆, n = 541; nip100-CG∆, n = 2696; tub2-430∆ nip100-CG∆, n = 2494 cells. Error bars represent SEP. Asterisks denote a significant difference from WT. *p < 0.001; determined by Fisher’s exact test. (C) Representative image of a WT cell expressing mRuby2-Tub1 and Mre11 labeled with mNeonGreen. Bar, 1 µm. (D) The percentage of cells containing Mre11 foci in preanaphase of the cell cycle. Percentages are calculated by number of cells containing Mre11 foci divided by number of cells in preanaphase of the cell cycle. WT, n = 1471; WT MMS, n = 794; tub2-430∆, n = 2178; kar9∆, n = 1448 cells. Error bars represent SEP. Asterisks denote a significant difference. *p < 0.001 determined by Fisher’s exact test.

