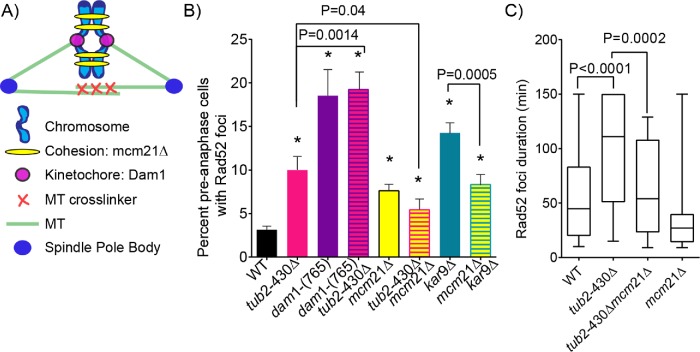
FIGURE 5:
Pericentric cohesion mutant decreases the frequency of DSBs in excessive nuclear migration mutants. (A) Schematic diagram of spindle components that make up and contribute to forces within the mitotic spindle. (B) The percentage of cells containing Rad52 foci in preanaphase of the cell cycle. Percentages are calculated by number of cells containing Rad52 foci divided by number of cells in preanaphase of the cell cycle. WT, n = 2581; tub2-430∆, n = 2653; tub2-430∆ mcm21∆, n = 276; mcm21∆, n = 1209; kar9∆, n = 891; mcm21∆ kar9∆, n = 621; dam1-(765), n = 135; dam1-(765) tub2-430∆, n = 135 cells. Error bars represent SEP. Asterisks denote a significant difference. *p < 0.05 determined by Fisher’s exact test. (C) Box and whisker plot of duration of Rad52 foci in minutes. The center bar denotes the median, box denotes the first and third quartiles, and whiskers are maxima and minima. The maximum duration is 150 min. Black bars represent the 95% CI. WT, n = 61; tub2-430∆, n = 35; tub2-430∆ mcm21∆, n = 42; mcm21∆, n = 18 cells; p values are determined by Mann–Whitney test.

