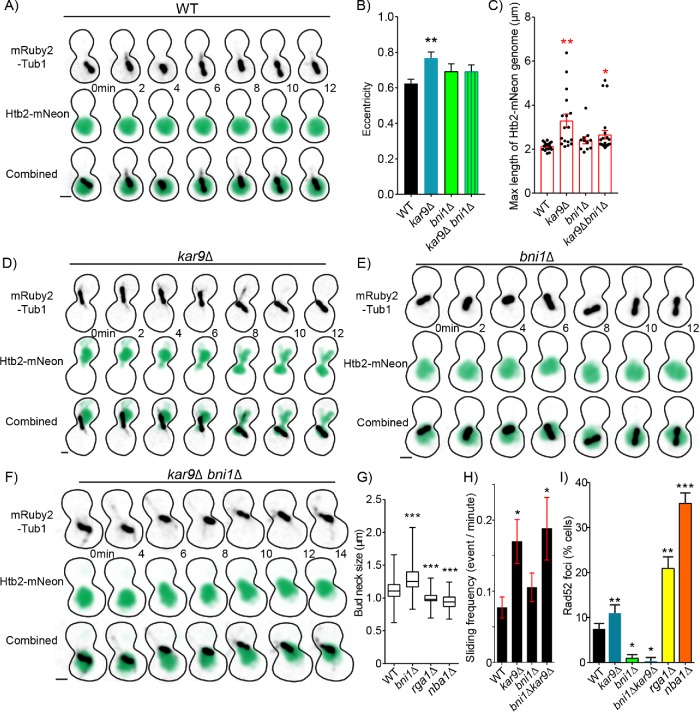
FIGURE 6:
Nuclear deformation increases the frequency of DSBs. (A) Time-lapse image series of Htb2-mNeonGreen and mRuby-Tub1 in a WT cell in preanaphase. Each image is a maximum intensity projection from a confocal z-series. Bar, 1 µm. (B) Mean of maximum eccentricity reached in preanaphase. Error bars represent the standard error of the mean. WT, n = 19; kar9∆, n = 17; bni1∆, n = 11; kar9∆ bni1∆, n = 23 cells. Asterisks denote a significant difference from WT. **p < 0. 0.001 determined by t test. (C) Dot plot of maximum length reached in micrometers of Htb2-mNeon-labeled genome of cell in preanaphase. Red bars represent the mean ± standard error of the mean. WT, n = 19; kar9∆, n = 17; bni1∆, n = 11; kar9∆ bni1∆, n = 23 cells. Asterisks denote a significant difference from WT.*p < 0.05; **p < 0.001 determined by t test. (D) Time-lapse image series of Htb2-mNeonGreen and mRuby-Tub1 in a kar9∆ mutant cell in preanaphase. Each image is a maximum intensity projection from a confocal z-series. Bar, 1 µm. (E) Time-lapse image series of Htb2-mNeonGreen and mRuby-Tub1 in a bni1∆ mutant cell in preanaphase. Each image is a maximum intensity projection from a confocal z-series. Bar, 1 µm. (F) Time-lapse image series of Htb2-mNeonGreen and mRuby-Tub1 in a kar9∆, bni1∆ double mutant cell in preanaphase. Each image is a maximum intensity projection from a confocal z-series. Bar, 1 µm. (G) Box and whisker plot of bud neck sizes in micrometers. The center bar denotes the median, the box denotes the first and third quartiles, and whiskers are maxima and minima. WT, n = 354; bni1∆, n = 108; rga1∆, n = 154; nba1∆, n = 163 cells. Asterisks denote a significant difference from WT. ***p < 0.0001 determined by Mann–Whitney test. (H) Mean frequency of sliding events. Cells were arrested in 200 mM hydroxyurea for 2 h and scored for microtubule sliding events (see Materials and Methods). WT, n = 35; kar9∆, n = 23; bni1∆, n = 35; bni1∆ kar9∆, n = 16 cells. Asterisks denote a significant difference from WT. *p < 0.05 determined by t -test. (I) The percentage of cells containing Rad52 foci in preanaphase of the cell cycle. Percentages are calculated by the number of cells containing Rad52 foci divided by the number of cells in preanaphase of the cell cycle. WT, n = 597; kar9∆, n = 598; bni1∆, n = 736; bni1∆ kar9∆, n = 754; rga1∆, n = 253 nba1∆, n = 429 cells. Error bars represent SEP. Asterisks denote a significant difference from WT. *p < 0.05; **p < 0.001; ***p < 0.0001 determined by Fisher’s exact test.

