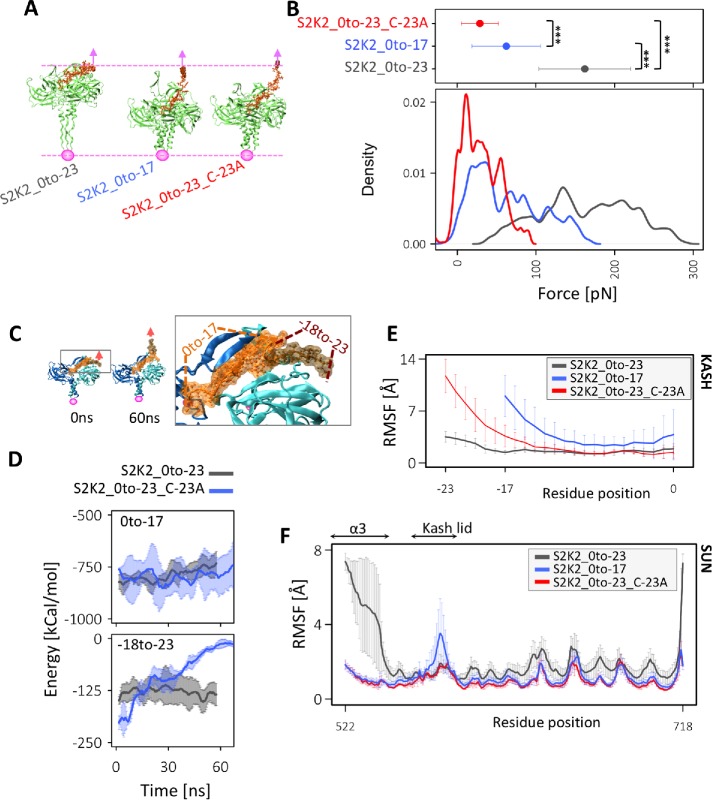
FIGURE 2:
Force transmission from KASH to SUN. (A) Representative images of the final simulation frames of each SUN–KASH model after 60 ns of pulling. (B) Magnitude of forces required to pull on KASH for 60 ns at 0.5 Å/ns (i.e., total displacement of 30 Å), average values of force for three independent 60-ns simulation runs are shown at the top (averaged over time and simulation run; error bars correspond to 1 SD), density plots are shown at the bottom; ***, P value < 2.2e-16). (C) Conformation of S2K2_0to-23_C-23A model before and after force application showing the detachment of residues –18 to –23 and zoomed view of SUN2–KASH2 interaction showing residues 0 to –17 and residues –18 to –23. (D) Nonbonded interaction energies between residues 0 and –17 and SUN trimer (top) or residues –18 to –23 (bottom) in S2K2_0to-23_C-23A indicating the dispensability of residues –18 to –23 in the absence of C-23. (E) Average RMSF of KASH peptides under force, where average RMSF values of each KASH residue are also averaged over three independent simulation runs, and three KASH peptides of the SUN2–KASH hexamer in each run. Error bars show the range of data over three runs and three KASH peptides in each run. (F) Average RMSF of SUN under force where average RMSF values of each SUN2 residue are also averaged over three independent simulation runs, and three SUN2 protomers of the SUN2–KASH2 hexamer in each run. Error bars show the range of data over three runs and three SUN2 protomers in each run.

